The CoreLogic Loan Performance Insights report features an interactive view of our mortgage performance analysis through February 2024.
Measuring early-stage delinquency rates is important for analyzing the health of the mortgage market. To more comprehensively monitor mortgage performance, CoreLogic examines all stages of delinquency as well as transition rates that indicate the percent of mortgages moving from one stage of delinquency to the next.
The report is published monthly with coverage at the national, state and Core Based Statistical Area (CBSA)/Metro level and includes transition rates between states of delinquency and separate breakouts for 120+ day delinquency.
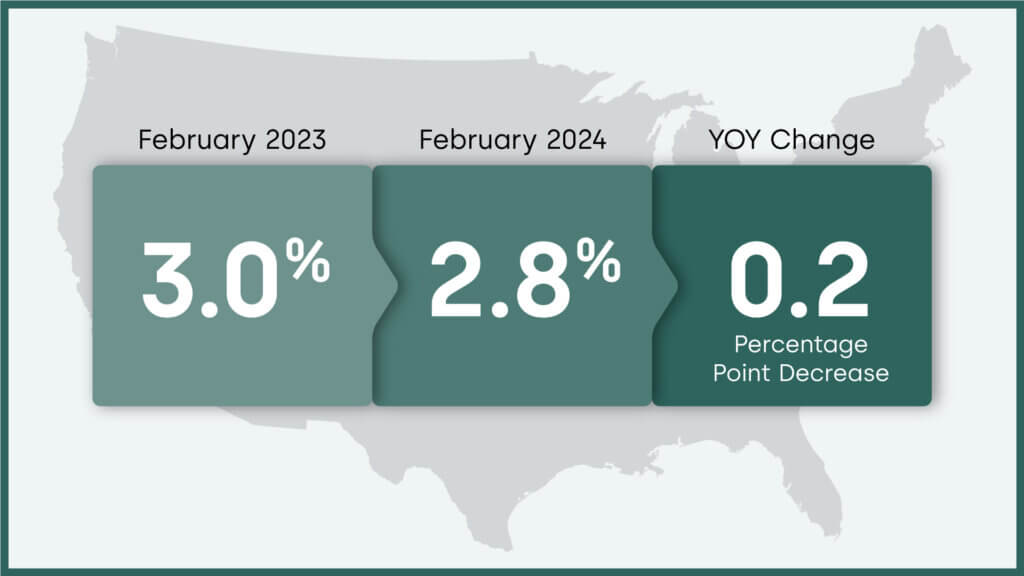
Chart 1: Overall U.S. mortgage delinquency rate and year-over-year change, February 2024
“The U.S. delinquency rate fell from a year earlier for the first time in six months in February, indicating that mortgage performance remains strong. The decrease in delinquencies was driven by the decline in the share of mortgages that were six months or more past due, a number that has been consistently shrinking and fell to its lowest level in 15 years in February. As later-stage delinquencies decrease, the share of mortgages in foreclosure remained at 0.3% in February, where it has been since March 2022 and only slightly higher than the all-time low.”
-Molly Boesel
Principal Economist for CoreLogic
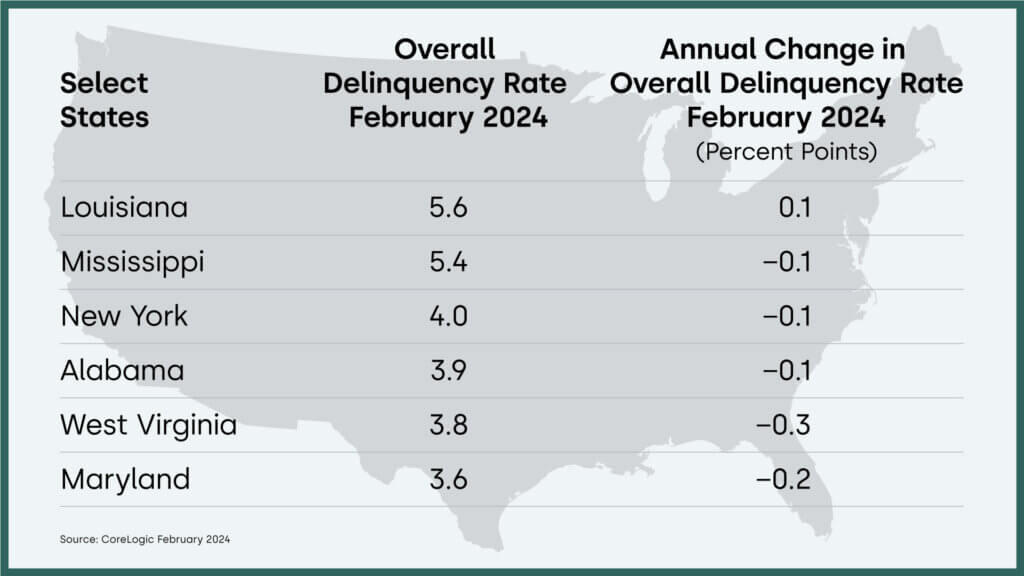
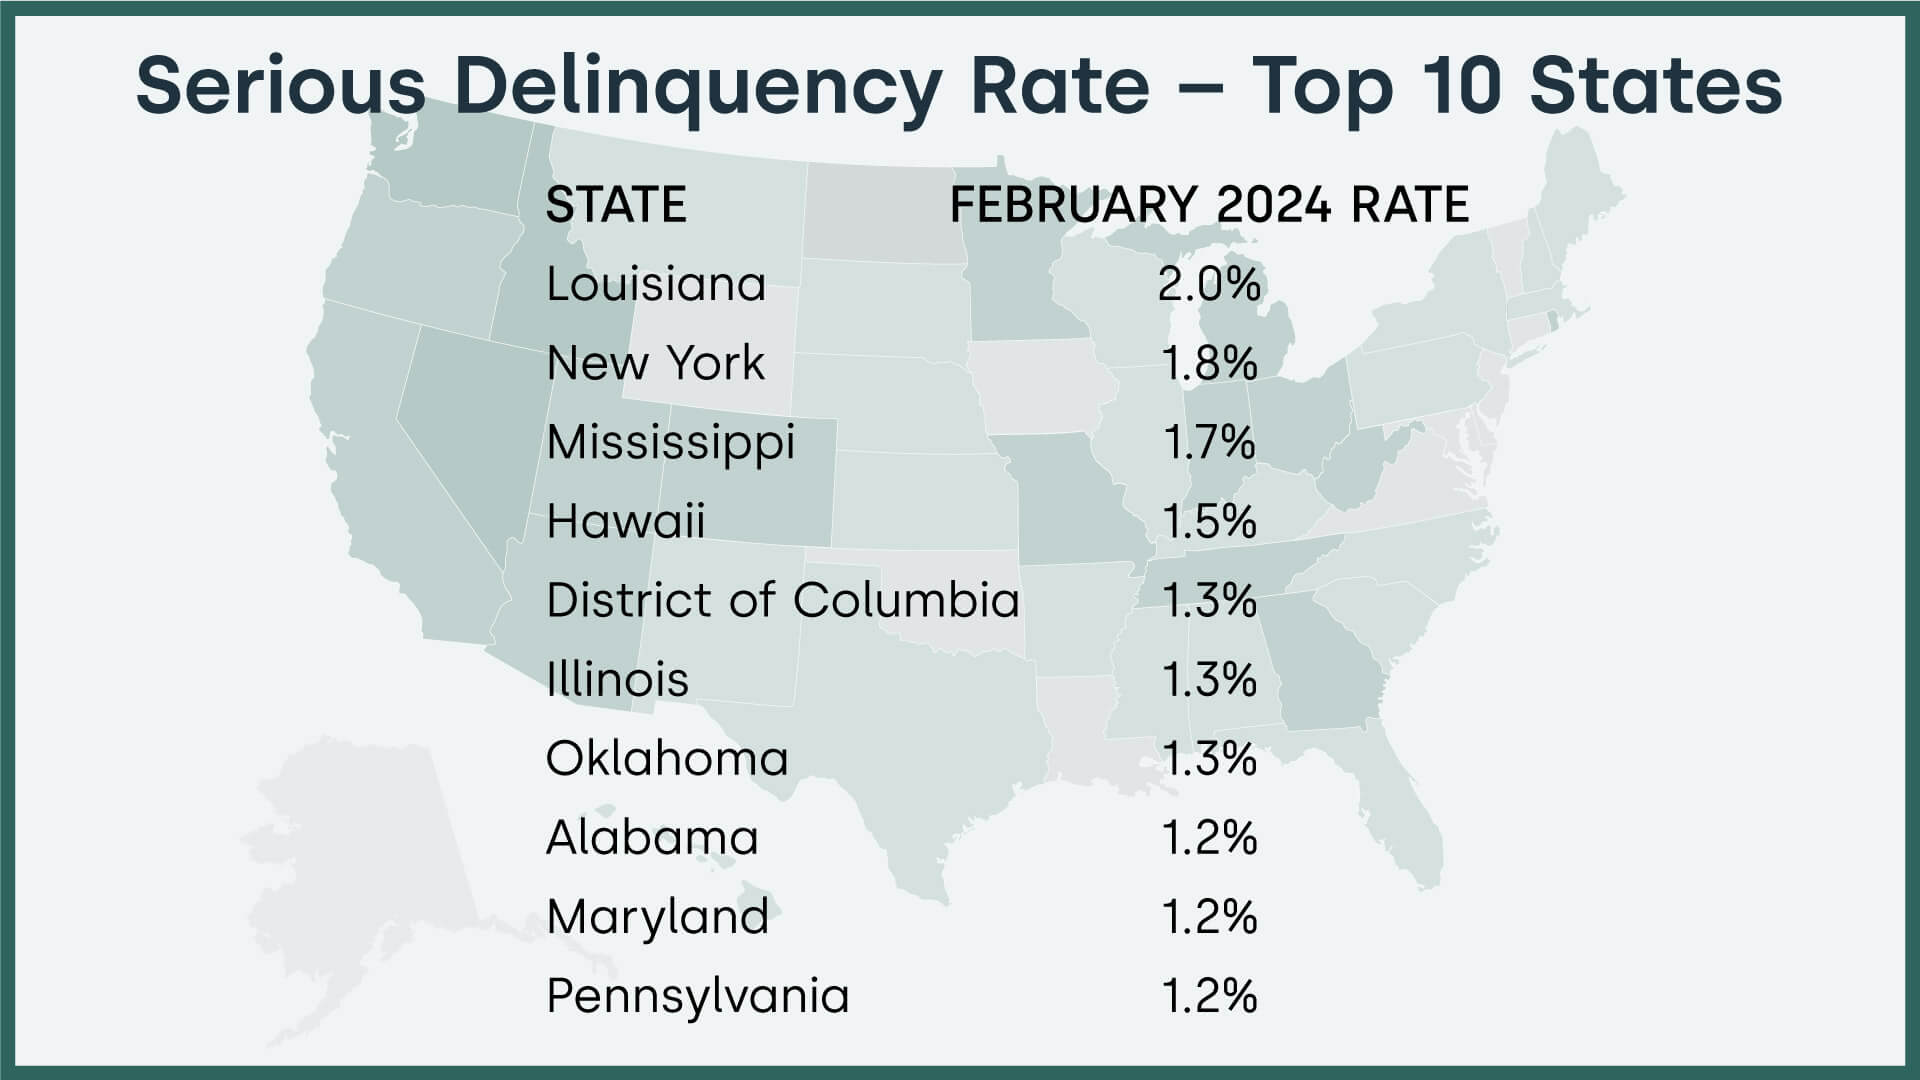
Chart 2: Overall U.S. mortgage delinquency rate by select state and year-over-year change, February 2024
30 Days or More Delinquent – National
In February 2024, 2.8% of mortgages were delinquent by at least 30 days or more including those in foreclosure. This represents a -0.2 percentage point decline in the overall delinquency rate compared with February 2023.
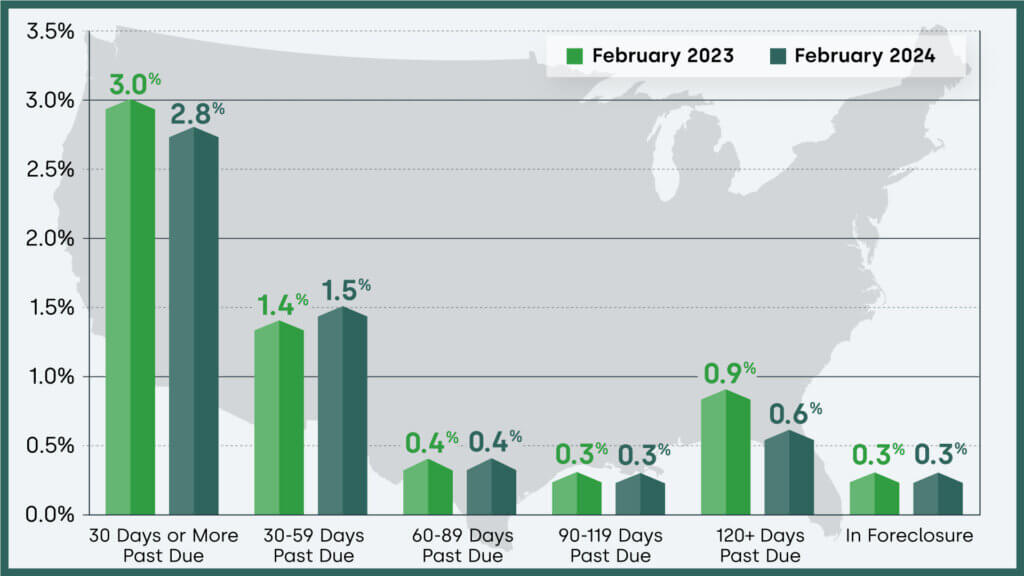
Chart 3: U.S. mortgage delinquency rates by time frame and year-over-year change, February 2024
Most Mortgage Delinquency Measures Hover Near Record Lows in February
Most Americans with a mortgage are still able to make their payments on time, with nearly all stages of delinquency remaining near historic lows in February. Only four states posted small year-over-year overall delinquency rate increases, the fewest since late summer 2023. Even if homeowners who are current on their mortgage payments begin to struggle, substantial U.S. home equity growth — which was up by $1.3 trillion (8.6%) on an annual basis in the fourth quarter — should provide many with a financial cushion that will help them avoid falling into foreclosure.
Loan Performance – National
CoreLogic examines all stages of delinquency to more comprehensively monitor mortgage performance.
The nation’s overall delinquency rate for February was 2.8%. The rate for early-stage delinquencies – defined as 30 to 59 days past due – was 1.5% in February 2024, up from February 2023. The share of mortgages 60 to 89 days past due was 0.4%, unchanged from February 2023. The serious delinquency rate – defined as 90 days or more past due, including loans in foreclosure – was 0.9%, down from 1.2% in February 2023.
As of February 2024, the foreclosure inventory rate was 0.3%, unchanged from February 2023.
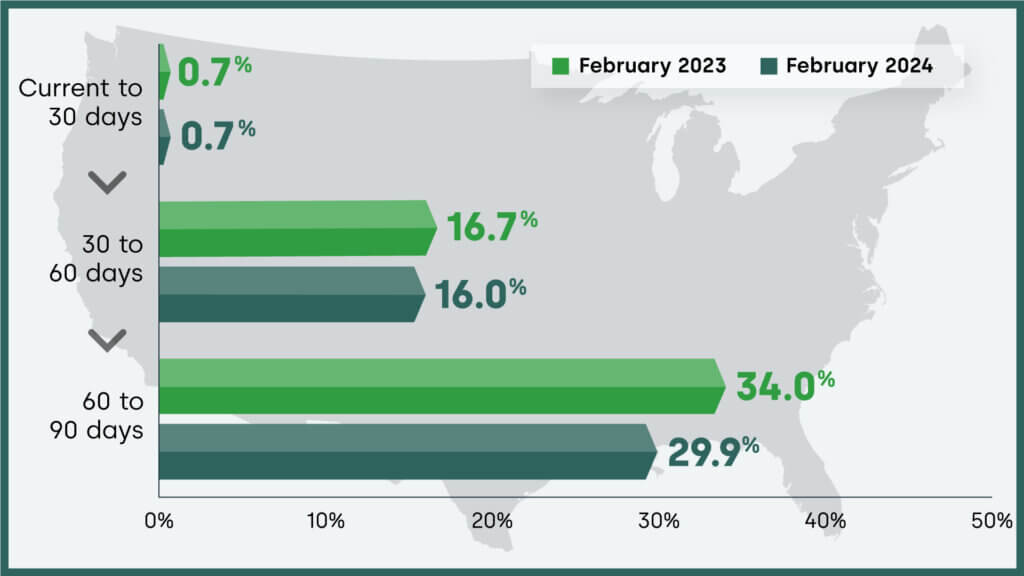
Transition Rates – National
CoreLogic examines all stages of delinquency as well as transition rates that indicate the percent of mortgages moving from one stage of delinquency to the next.
The share of mortgages that transitioned from current to 30-days past due was 0.7%, unchanged from February 2023.
Chart 4: Share of delinquent mortgages transitioning from one stage to the next and year-over-year change, February 2024
Overall Delinquency – State
In February 2024, four states posted year-over-year increases in overall delinquency rates, while eight states were unchanged. Alaska posted the largest annual decline, at -0.4%.
Chart 5: Year-over-year change in overall mortgage delinquency rate by all states and districts, February 2024
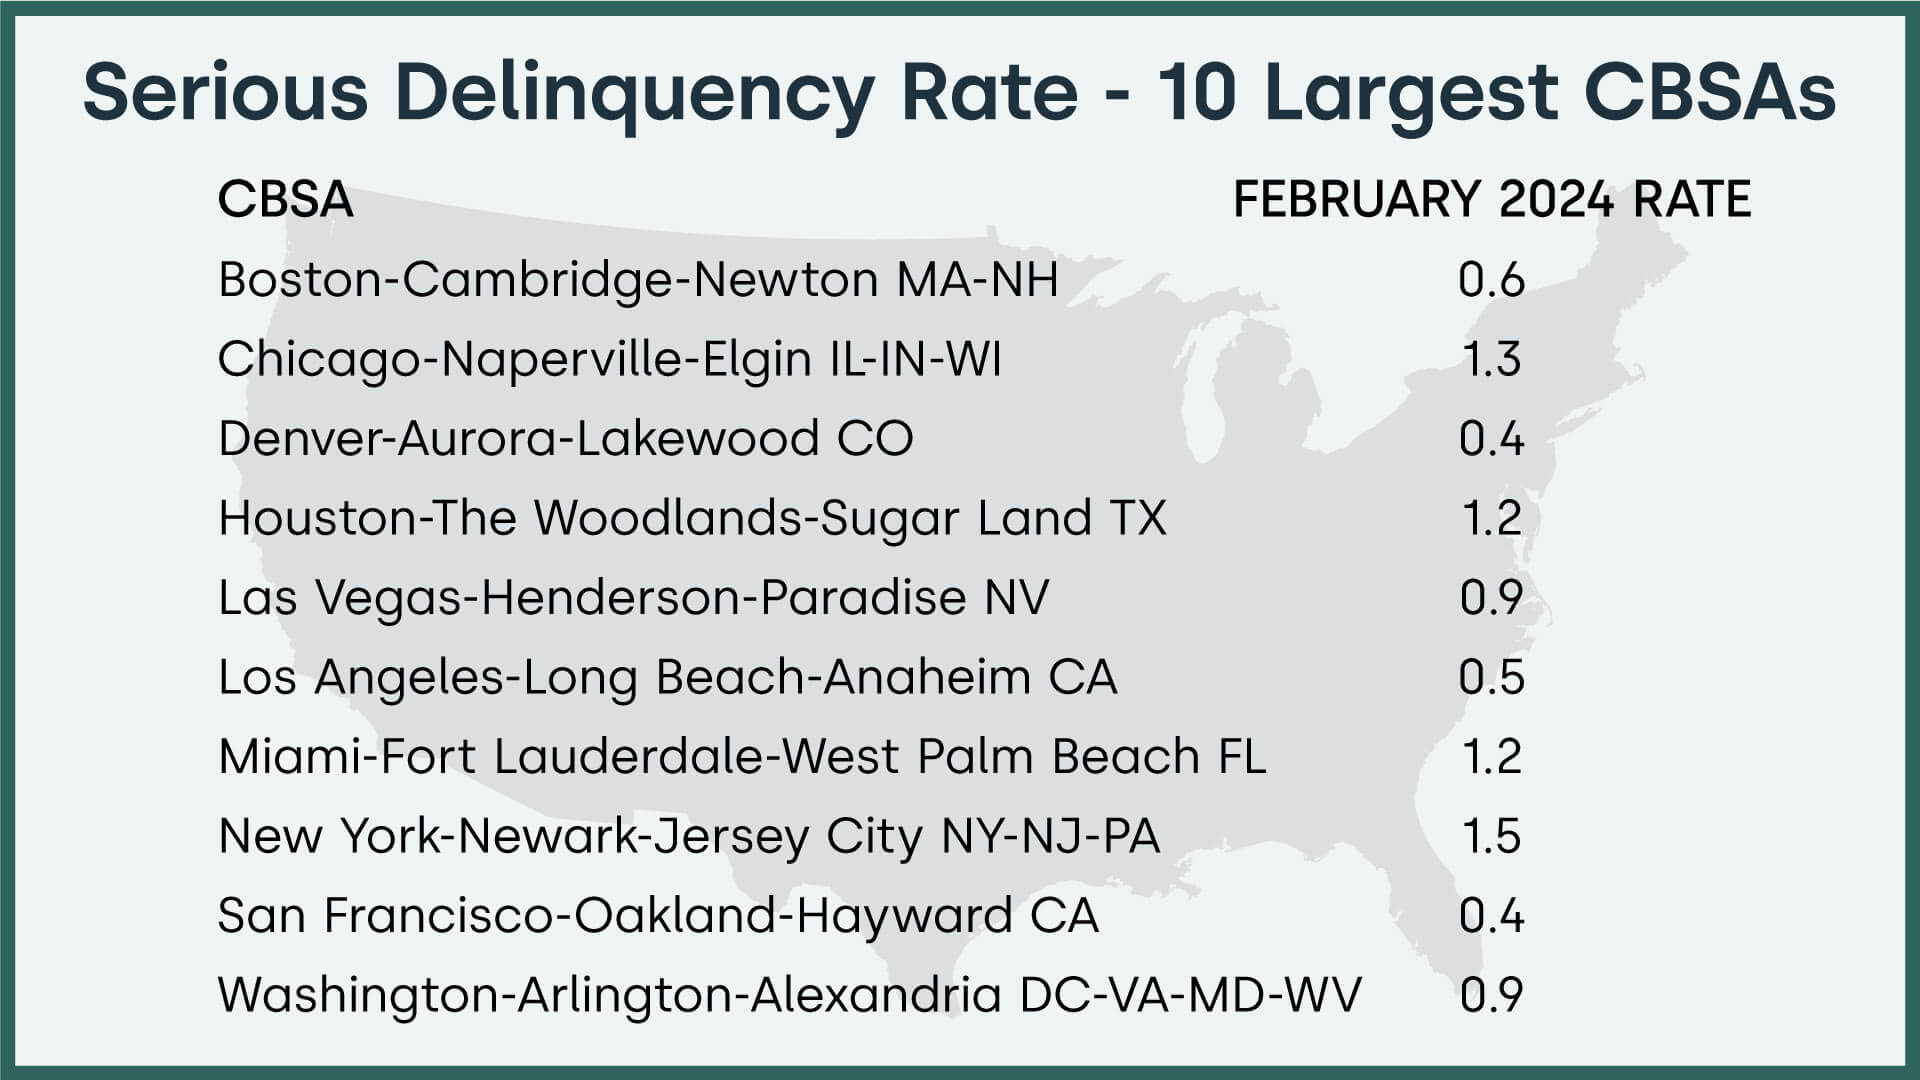
Serious Delinquency – Metropolitan Areas
Serious delinquency is defined as 90 days or more past due including loans in foreclosure.
There were three metropolitan areas where the Serious Delinquency Rate increased.
There were 25 metropolitan areas where the Serious Delinquency Rate stayed the same.
There were 356 metropolitan areas where the Serious Delinquency Rate decreased.
Chart 6: Year-over-year change in serious mortgage delinquency rate by metro area, February 2024
Summary
Measuring early-stage delinquency rates is important for analyzing the health of the mortgage market. To more comprehensively monitor mortgage performance, CoreLogic examines all stages of delinquency as well as transition rates that indicate the percent of mortgages moving from one stage of delinquency to the next.
The data in this report represents foreclosure and delinquency activity reported through February 2024. The data in this report accounts for only first liens against a property and does not include secondary liens. The delinquency, transition and foreclosure rates are measured only against homes that have an outstanding mortgage. Homes without mortgage liens are not subject to foreclosure and are, therefore, excluded from the analysis. Approximately one-third of homes nationally are owned outright and do not have a mortgage. CoreLogic has approximately 75% coverage of U.S. foreclosure data.
Source: CoreLogic
The data provided are for use only by the primary recipient or the primary recipient’s publication or broadcast. This data may not be resold, republished or licensed to any other source, including publications and sources owned by the primary recipient’s parent company without prior written permission from CoreLogic. Any CoreLogic data used for publication or broadcast, in whole or in part, must be sourced as coming from CoreLogic, a data and analytics company. For use with broadcast or web content, the citation must directly accompany first reference of the data. If the data are illustrated with maps, charts, graphs or other visual elements, the CoreLogic logo must be included on screen or website. For questions, analysis or interpretation of the data, contact Robin Wachner at [email protected]. For sales inquiries, please visit https://www.corelogic.com/support/sales-contact/. Data provided may not be modified without the prior written permission of CoreLogic. Do not use the data in any unlawful manner. The data are compiled from public records, contributory databases and proprietary analytics, and its accuracy is dependent upon these sources.
About CoreLogic
CoreLogic, the leading provider of property insights and solutions, promotes a healthy housing market and thriving communities. Through its enhanced property data solutions, services and technologies, CoreLogic enables real estate professionals, financial institutions, insurance carriers, government agencies and other housing market participants to help millions of people find, buy and protect their homes. For more information, please visit www.corelogic.com.
CORELOGIC, the CoreLogic logo, CoreLogic LPI and CoreLogic LPI Forecast are trademarks of CoreLogic, Inc. and/or its subsidiaries. All other trademarks are the property of their respective owners.