
CoreLogic’s Climate Risk Analytics (CRA) show that U.S. homebuyers increasingly migrated to higher-risk climates during the height of the pandemic
A CoreLogic analysis from last fall showed that most homebuyer out-migration was occurring in expensive coastal metro areas. When homebuyers relocated to a different metro, they often chose areas that were adjacent to their current location, had a lower cost of living or sometimes both.
Economic factors play a crucial role in migration trends, as households often seek affordability and job opportunities when deciding to move. Additionally, some homebuyers are drawn to natural amenities, such as nearby water views or open spaces. However, this pursuit of affordability or outdoor recreation may sometimes lead potential buyers to areas with increased climate risk.
For this analysis, CoreLogic examined census tract (CT)-level-data to track homebuyer mobility patterns from 2013 to 2023. This study combines CoreLogic loan application data with CRA Composite Risk Scores to better understand migration patterns over the past decade.
Distribution of Census Tracts by Climate Risk Category
Figure 1 shows the CRA Composite Risk Scores at the CT level, which represent the value-weighted CRA Composite Risk Scores within each CT. [1] The map shows that certain U.S. areas are riskier than others. According to CoreLogic data, about 8% of the 84,000 CTs in the U.S. fall into the high- to extreme-risk categories in terms of exposure to natural perils, which include wildfires, floods, hurricanes, and storms. Areas most vulnerable to climate risk are concentrated in Florida, California, Texas, Louisiana and Oklahoma. Specifically:
- 21% of high- to extreme-risk CTs are in Florida.
- 20% of high- to extreme-risk CTs are in California.
- 12% of high- to extreme-risk CTs are in Texas.
- 8% of high- to extreme-risk CTs are in Louisiana.
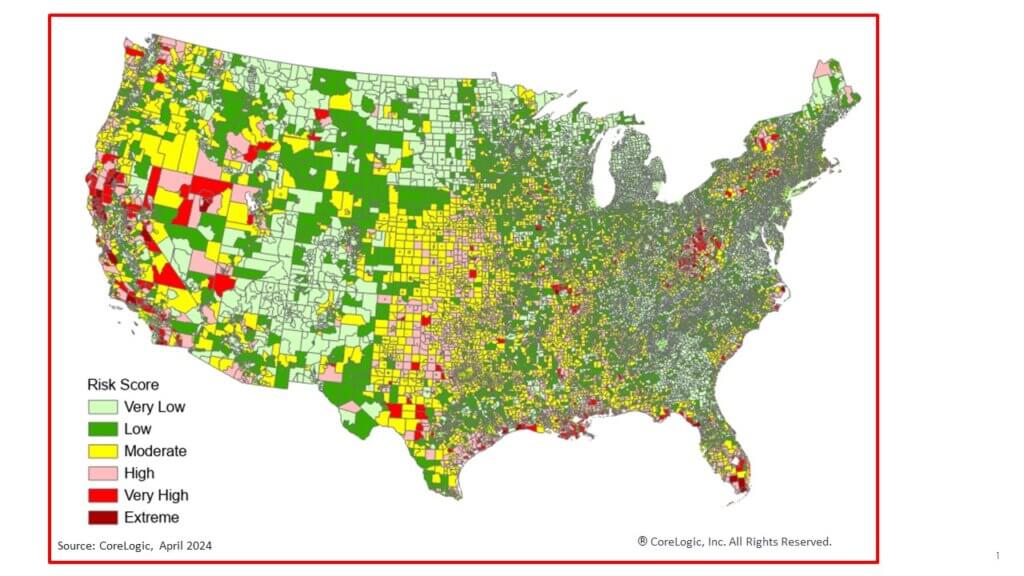
Source: CoreLogic CRA Composite Risk Scores
© 2024 CoreLogic,Inc., All rights reserved.
IN/OUT Ratios of Loan Applications to Higher Climate Risk Areas from Lower Risk Areas Over the Past Decade
Figure 2 illustrates the in-migration/out-migration (IN/OUT) ratio based on loan application activity. In other words, this ratio represents the proportion of potential homebuyers applying for loans in CTs with higher climate risk compared with CTs where they currently reside, versus those applying for loans in CTs with lower climate risk. For example, a ratio of 1.2 in 2023 means that there were 120 households attempting to buy properties in high-risk CTs migrating from low-risk CTs, compared with every 100 moving to low-risk CTs from high-risk CTs.
Since 2013, the IN/OUT ratio indicates that more households migrated to areas with higher climate risk from lower-risk areas than the opposite. However, during the pandemic (specifically in 2020 and 2021), the IN/OUT ratio of Americans moving to areas more vulnerable to natural disasters reached its peak before basically returning to its pre-pandemic level in 2023.
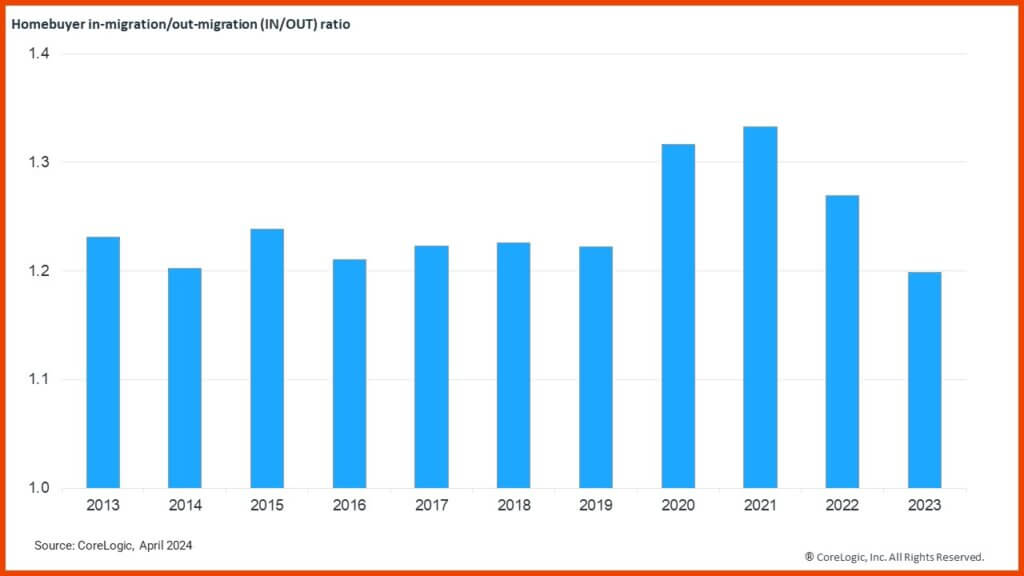
Source: CoreLogic Loan Application Data and CoreLogic CRA Composite Risk Scores
© 2024 CoreLogic,Inc., All rights reserved.
During the pandemic, there was a surge in homeowner desire for larger spaces and access to natural amenities, with affordability remaining a major concern. Remote-work flexibility increased during the pandemic, which prompted those who lived in major expensive cities (such as New York; Los Angeles; San Jose, California; Boston and San Francisco) to relocate to smaller communities with natural amenities and open spaces. Consequently, migration patterns shifted not only from large urban areas to suburbs but also from lower-risk areas to places with higher climate risks.
For instance, a larger number of prospective homebuyers from the Los Angeles and San Diego metros have been relocating to nearby Riverside. Compared with Los Angeles and San Diego, Riverside has a greater proportion of CTs categorized as high risk. Riverside County is also a considerably less expensive housing market than Los Angeles or San Diego counties. According to CoreLogic’s most recent Southern California Housing Market Update, Riverside County had a February 2024 median home sales price of $567,500, compared with Los Angeles ($845,000) and San Diego ($825,000).
CoreLogic experts routinely weigh in on the effects of climate change on the housing market and natural catastrophes. And for all the latest insights on economic and housing market trends, regularly visit our Office of the Chief Economist’s home page.
[1] The CoreLogic CRA Composite Risk Score value ranges from 1-100, based on the sum of the Average Annual Loss (AAL) relative to the calculated Reconstruction Cost Value (RCV).
Written by: Archana Pradhan