
- White people took out 62% of new mortgages last year, down from 64% in 2022 and 70% in 2018. Meanwhile, the share taken out by Hispanic, Black and Asian buyers ticked up.
- People of color are taking out a rising share of mortgages because an increasing share of them are of prime homebuying age, and because America is becoming more diverse.
- Hispanic, Black and Asian people have also seen larger income gains than white people in recent years.
The share of U.S. mortgages taken out by white homebuyers has declined over the last five years, while the share taken out by Hispanic, Black and Asian homebuyers has ticked up.

That’s according to a Redfin analysis of 2018-2023 Home Mortgage Disclosure Act (HMDA) data covering mortgage originations for primary homes. This analysis does not cover originations for investment properties or second homes.
Just under two-thirds (62.2%) of new mortgages issued in 2023 went to white homebuyers. While that’s a far higher share than any other group, it’s down from 64% in 2022 and 70.4% in 2018. It’s also now more in line with the country’s demographics, as 59.5% of the U.S. population is white (as of 2022, the most recent year for which data is available).
Meanwhile, the share of new mortgages taken out by Hispanic buyers increased to 14% in 2023 from 12.6% in 2022 and 11% in 2018. Black buyers represented 8.7% of new mortgage holders last year—little changed from 8.6% in 2022 but up from 7.1% in 2018. Still, these figures lag demographic trends, as 18.8% of the U.S. population is Hispanic and 12.2% of the population is Black.
Asian buyers took out 8.2% of new mortgages in 2023, unchanged from 2022 but higher than the 6.4% rate in 2018. Asian mortgage holders are tracking slightly ahead of demographic trends, as 5.9% of the U.S. population is Asian.
All in all, people who are Hispanic, Black, Asian or two or more races took out 37.8% of new mortgages last year, up from 36% in 2022 and 29.6% in 2018.
“The pool of homebuyers taking out mortgages is becoming less white because America is becoming more diverse, and many people of color are in their prime homebuying years,” said Redfin Senior Economist Elijah de la Campa. “The racial wage gap, while still sizable, has also been shrinking. That has made homeownership more feasible for some Black and Hispanic people, though they’re still significantly less likely to own homes than white people.”
In the following four sections, we delve deeper into why nonwhite buyers are taking out a growing share of new mortgages in the U.S.
Hispanic, Black and Asian People Have Seen Larger Income Gains Than White People
The median annual income for Hispanic people in the U.S. was an estimated $69,000 in 2023, up 40.2% from 2018. That’s much larger than the gain for white people, whose median income rose 31% to an estimated $86,000. Black and Asian people also saw bigger increases in estimated incomes, which climbed a respective 34.7% to $54,000 and 36.4% to $114,000. It’s worth noting that the unemployment rate in the Black population has ticked up in recent months.
The racial wage gap remains large, but has shrunk in recent years in part due to a tight labor market. When the labor market is tight, employers are often less selective and look for candidates outside of their networks, which provides opportunities for marginalized communities.
A handful of states have also increased the minimum wage in recent years, which disproportionately impacts workers of color, who are more likely to work low-wage jobs.
America Is Becoming More Diverse
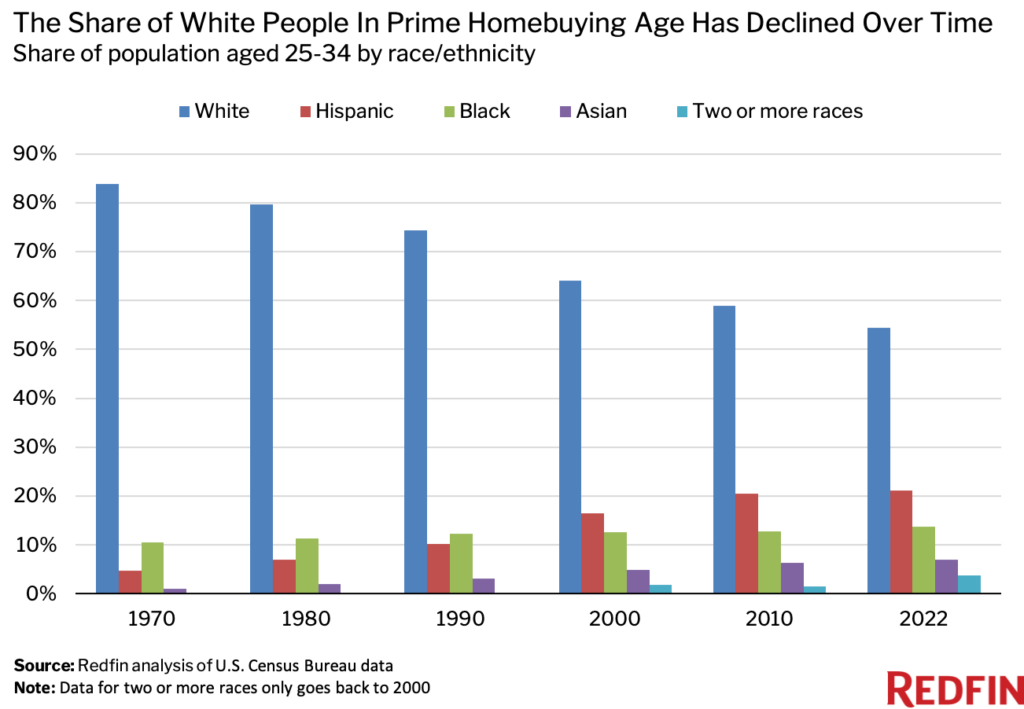
White people make up 59.5% of the U.S. population (as of 2022), down from 61.6% in 2018, 69.7% in 2000 and 84.1% in 1970. Meanwhile, people of color have taken up a growing share of the population, with Hispanic people seeing the biggest uptick. They represent 18.8% of the U.S. population, up from 18% in 2018, 12.6% in 2000 and 4.1% in 1970. Asian people make up 5.9%, up from 5.6% in 2018, 3.7% in 2000 and 0.7% in 1970. People of two or more races represent 3.6%, up from 2.4% in 2018 and 1.8% in 2000—the furthest back the data for this group goes.
The Black share of the population is the exception, stagnating in comparison; at 12.2%, it’s little changed from 12.4% in 2018 and 12.1% in 2000, but is up slightly from 11% in 1970.
The number of people in the U.S. who identify as white (a different metric than the share) recently declined for the first time since 1790.
“In addition to lower fertility and immigration, much of this loss is attributable to the continued aging of the white population. Fewer births and more deaths resulted in a natural decrease (more deaths than births) for the 2010s decade, even before the COVID-19 pandemic,” William Frey, a senior fellow at the Brookings Institution, wrote in a 2021 report. “In addition, the rise of multiracial marriages has led to an increase in the number of young people who identify as mixed race rather than white alone. The new census results also show a substantial rise in the number of Americans that indicated belonging to two or more racial groups.”
A Rising Share of Hispanic, Black and Asian People Are of Prime Homebuying Age
More than one in five (21.1%) Hispanic people living in the U.S. are of prime homebuying age (25-34), up from 20.6% in 2018 and 16.5% in 2000. Meanwhile, 13.7% of Black U.S. residents are of prime homebuying age, up from 13.4% in 2018 and 12.6% in 2000. The share has also ticked up among Asian people, to 7% from 6.9% in 2018 and 4.9% in 2000.
But the opposite is true for white people, 54.4% of whom are of prime homebuying age. While that’s a higher share than any other group, it’s down from 56.6% in 2018 and 64.1% in 2000. Please note that the most recent year in this dataset is 2022.
The most common age among white people in the U.S. is 60—far beyond prime homebuying age. That’s roughly double the most common ages of Black and Asian people and five times higher than the most common age of Hispanic people.
One reason white people are older is they were the largest population gainers from the post-World War II baby boom—a time before many of today’s immigrants moved to the U.S., according to an analysis from Pew Research Center.
White People Are Buying Fewer Homes Than They Used to
White people took out 1,582,643 mortgages in 2023, down 22.1% from a year earlier and down 31.3% from 2018. By comparison, Hispanic people took out 355,757 mortgages, down just 11.1% year over year and down 1.3% from 2018. Asian people took out 209,085 mortgages, down 19.9% year over year and down 0.5% from 2018. And Black people took out 220,410 mortgages, down 19.4% from a year earlier and down 5.7% from 2018.

Home purchases have dropped across the board over the past year due to rising mortgage rates and high home prices, but it’s notable that the declines were more severe among white people.
Most white people already own homes, meaning there’s not a lot of room for growth. Nearly three-quarters (74%) of white people in the U.S. own homes, compared with 62.2% of Asian people, 49.9% of Hispanic people and 45.7% of Black people.
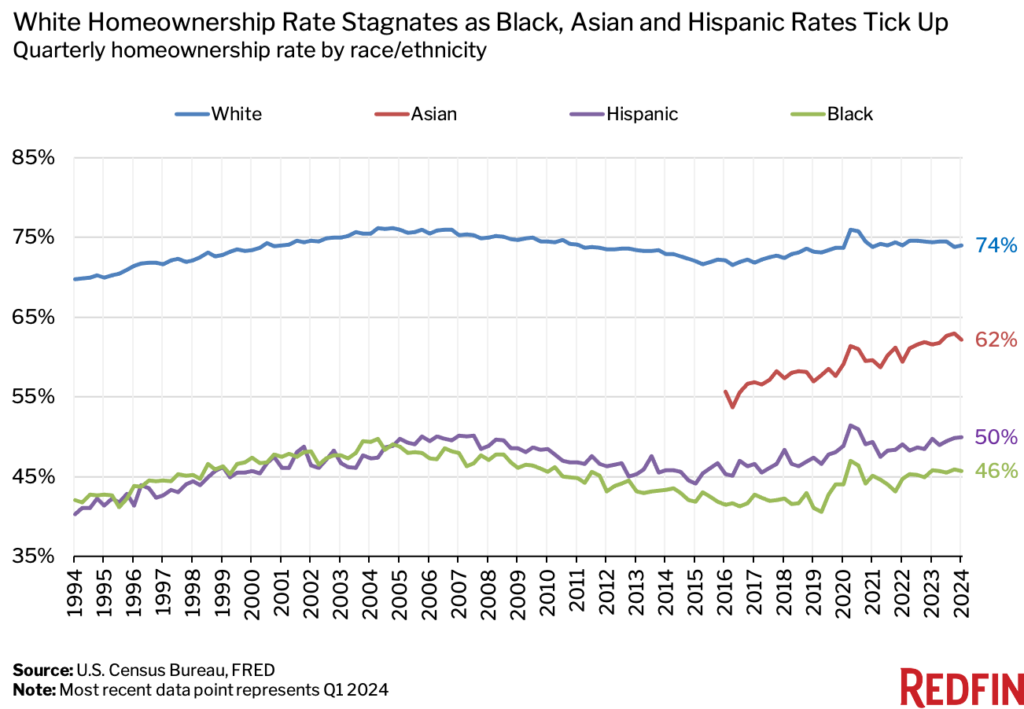
While white people are the most likely to be homeowners, it’s worth noting that their homeownership rate has stagnated in recent years while the homeownership rates for Hispanic, Black and Asian people have climbed—helping to narrow the gap slightly. For example, the Black-white homeowner gap was 28.3 percentage points in the first quarter of 2024, down from 32.1 percentage points in the first quarter of 2019. The Hispanic-white gap fell to 24.1 percentage points from 25.8 percentage points over the same period, and the Asian-white gap fell to 11.8 percentage points from 16.3 percentage points.
Methodology
In this report, “Asian” refers to people who are Asian, Pacific Islander, and/or Native Hawaiian; “Hispanic” refers to people who are Hispanic/Latino; “white” refers to people who are non-Hispanic white; “Black” refers to people who are Black or African American; and “two or more races” refers to people who are more than one race or ethnicity.
When calculating the share of mortgage originations by race/ethnicity, the denominator excludes home purchasers who were categorized as Native American or missing race. Out of all primary mortgage originations in the study period, at most 0.2% in a given year were for Native American purchasers, and at most 11.8% were for those with a missing race.
We used the same approach when calculating the share of the population by race/age using Census data.
The U.S. median household incomes by race for 2023 were estimated using the U.S. Census Bureau’s (ACS) 2022 race-specific median household income and 12-month moving average nominal wage growth rates compiled from the Current Population Survey and reported by the Federal Reserve Bank of Atlanta.
Census data on the share of population by race and age is as of 2022—the most recent year available.
Written by: Lily Katz