
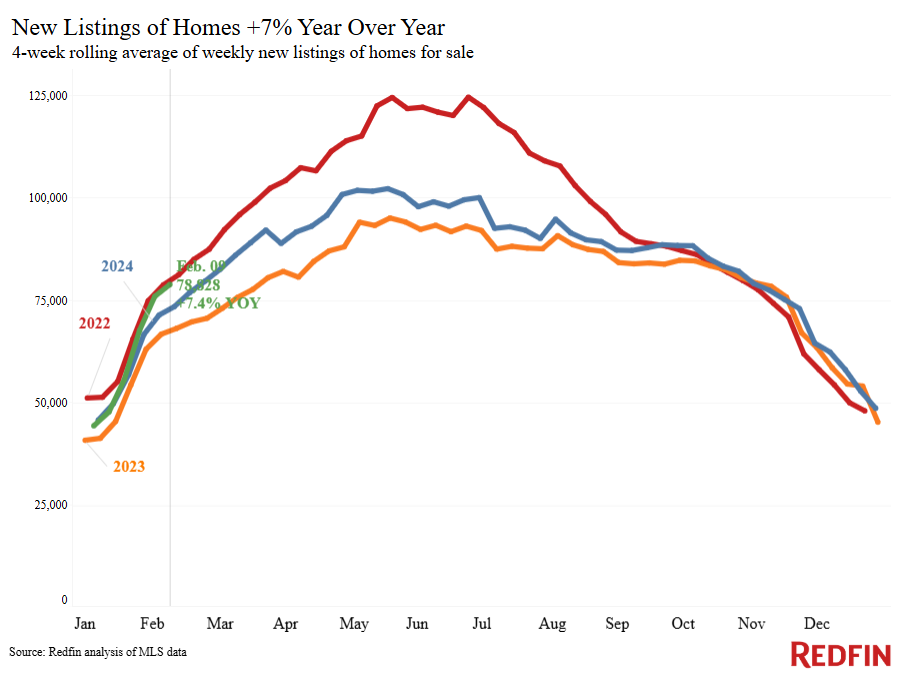
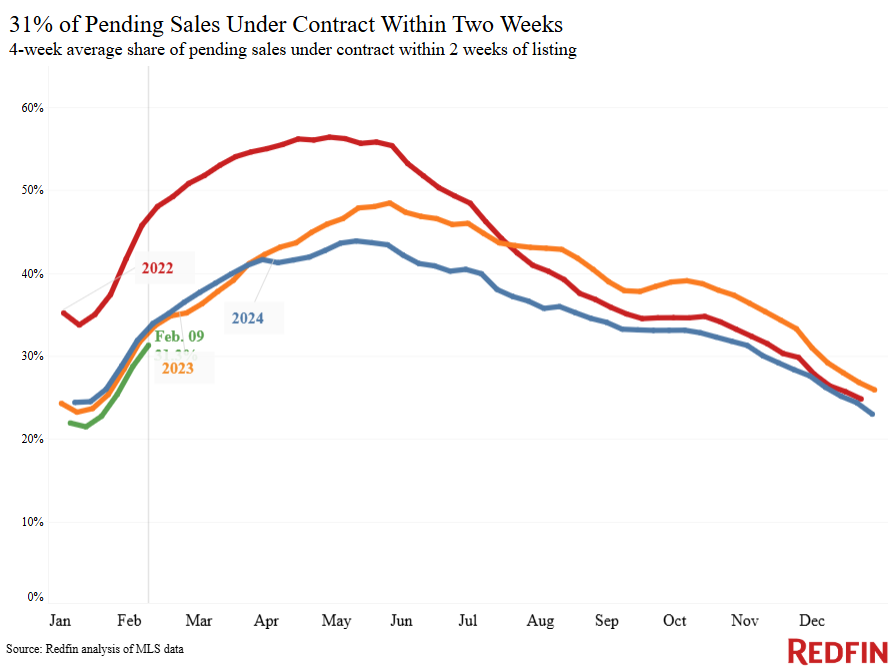
- New listings are up 7.4% from a year earlier, while pending sales are down 6%. Sales are slow mostly because of high home prices and mortgage rates.
- In Washington, D.C. and other places with a high concentration of government workers, Redfin agents report some buyers and sellers are changing plans due to uncertainty about their jobs.
- In Los Angeles, pending sales rose after five weeks of declines, possibly due to an influx of affluent buyers who lost their homes in recent wildfires.
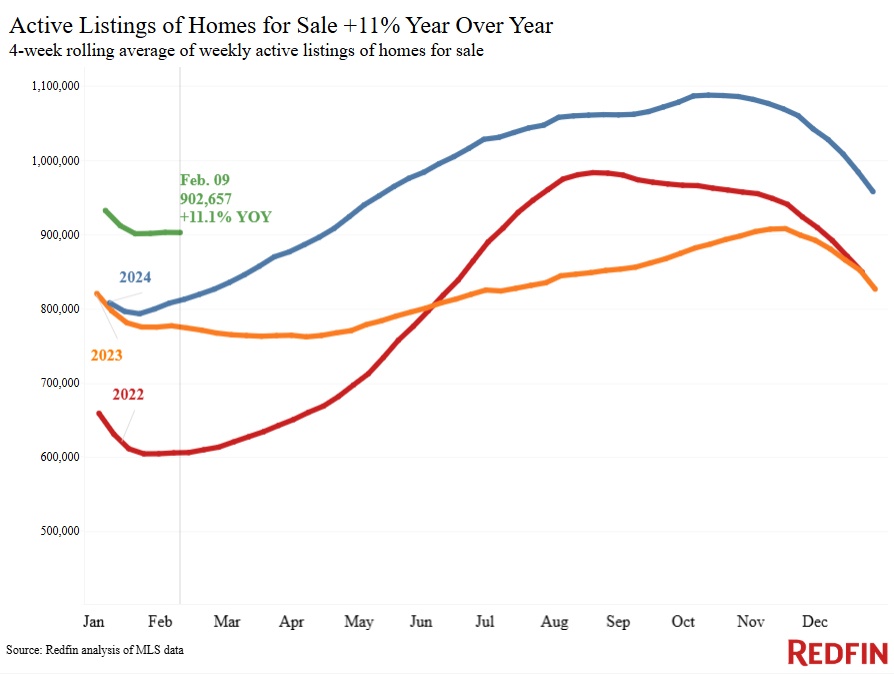
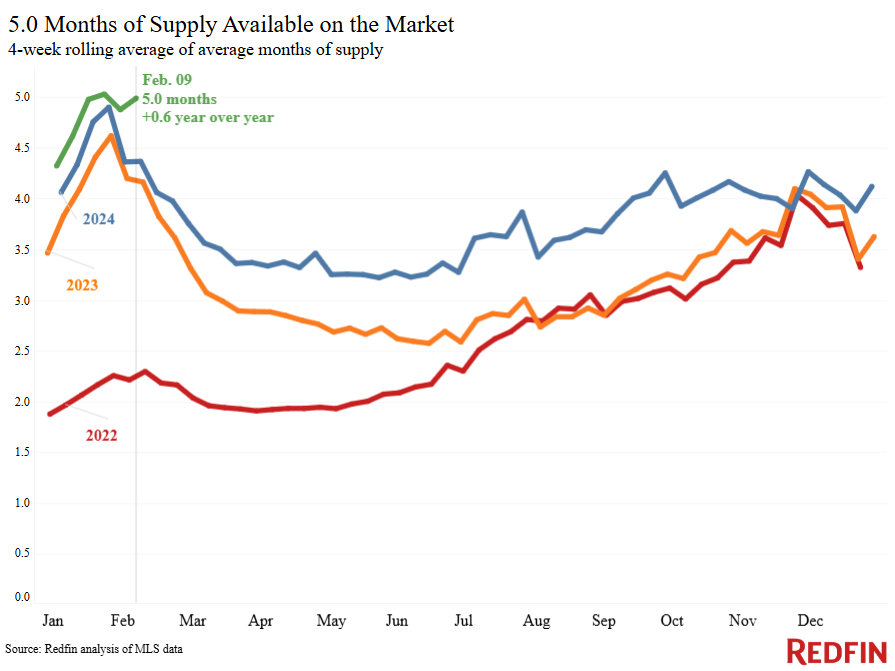
There are five months of for-sale supply on the market nationwide, up from 4.4 months a year earlier and the most since early 2019. Inventory is piling up because more sellers are listing their homes while fewer buyers are wading into the market.
New listings rose 7.4% year over year during the four weeks ending February 9, hitting their highest level for any comparable time period since 2022. Just after this time in 2022, mortgage rates started rising quickly, encouraging many homeowners to stay put to hold onto low rates. Now, that lock-in effect is starting to ease.
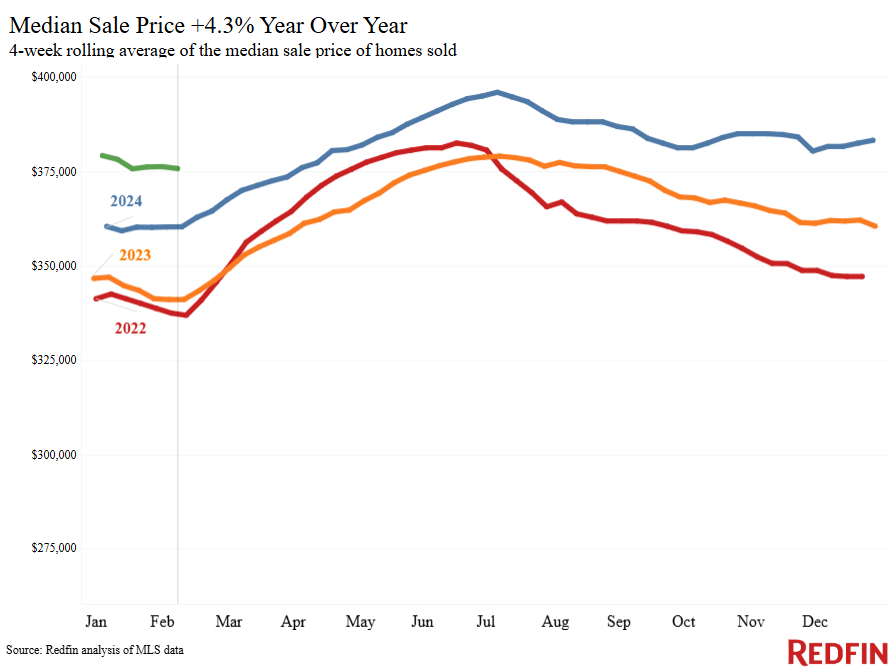
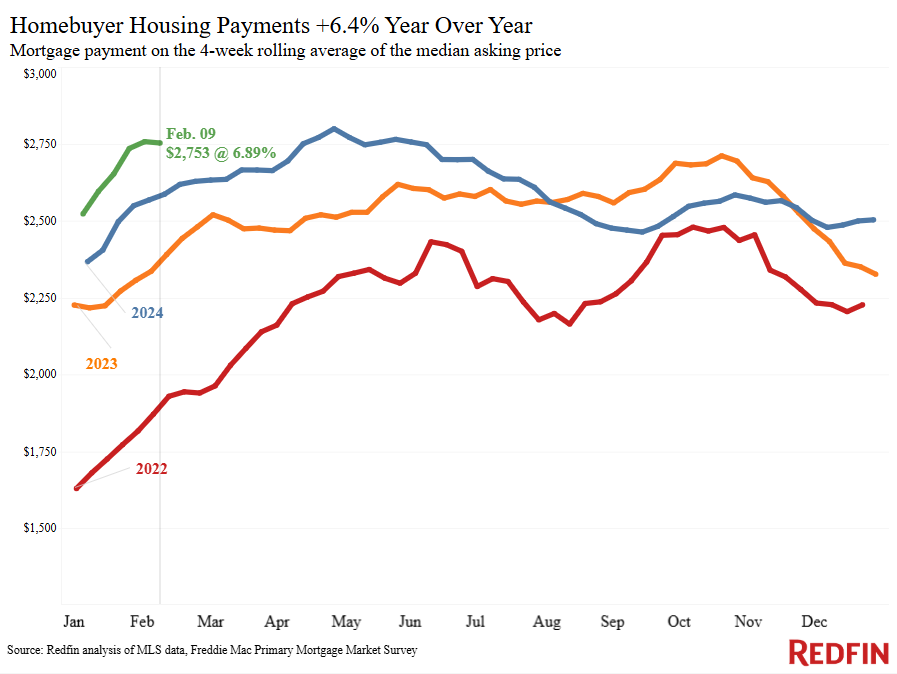
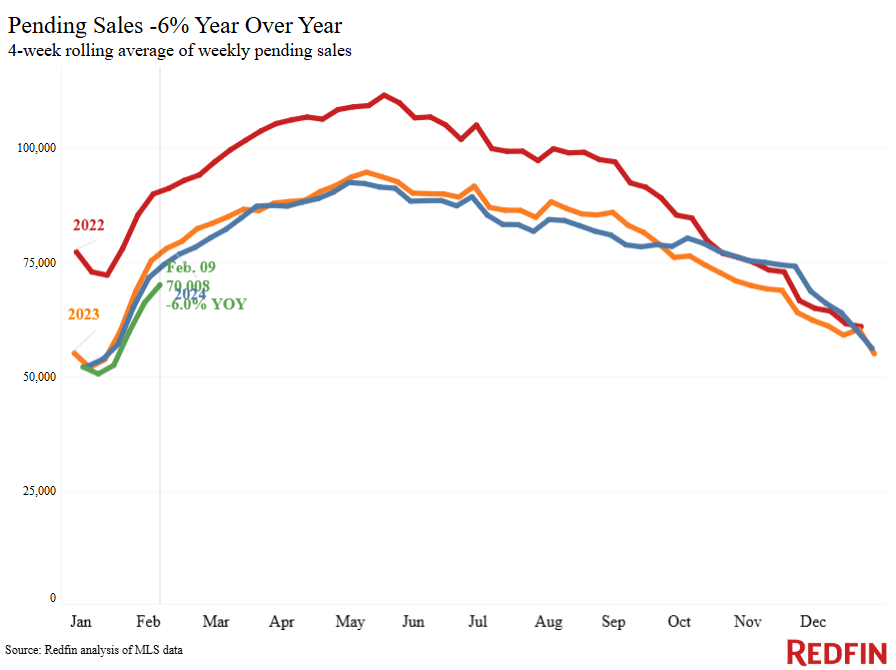
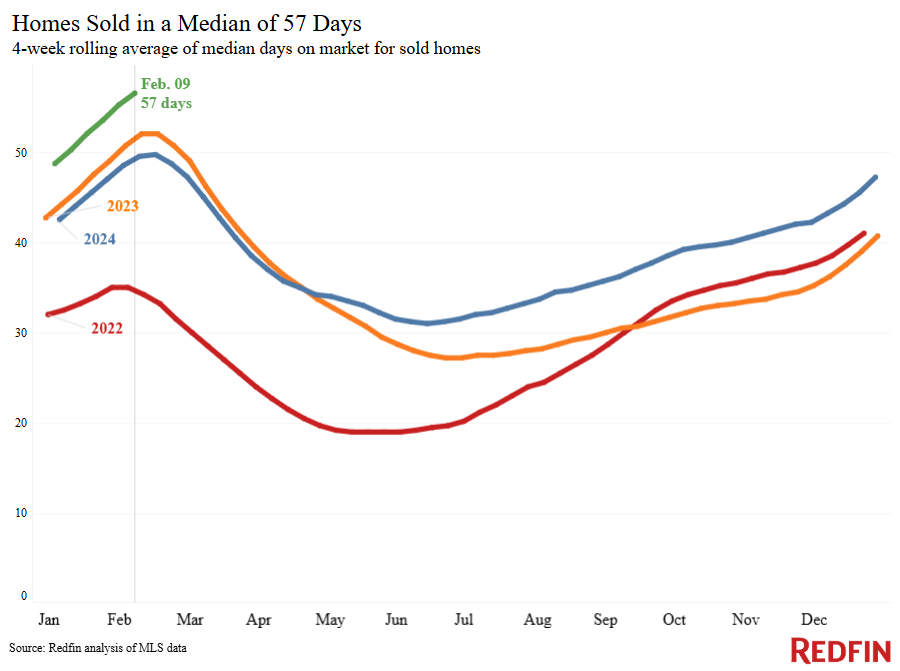
Pending home sales, meanwhile, fell 6%, similar to the declines we’ve seen since the start of the year. The typical home that sold in that period took 57 days to go under contract–the longest span since March 2020, when the onset of the pandemic nearly ground the housing market to a halt. Sales are slow mostly because housing costs are high, with the median monthly housing payment sitting just $46 below its all-time high. Home-sale prices are up 4.3% year over year, and the weekly average mortgage rate is 6.89%, down slightly from a week earlier but still more than double the average pre-pandemic and early-pandemic rates.
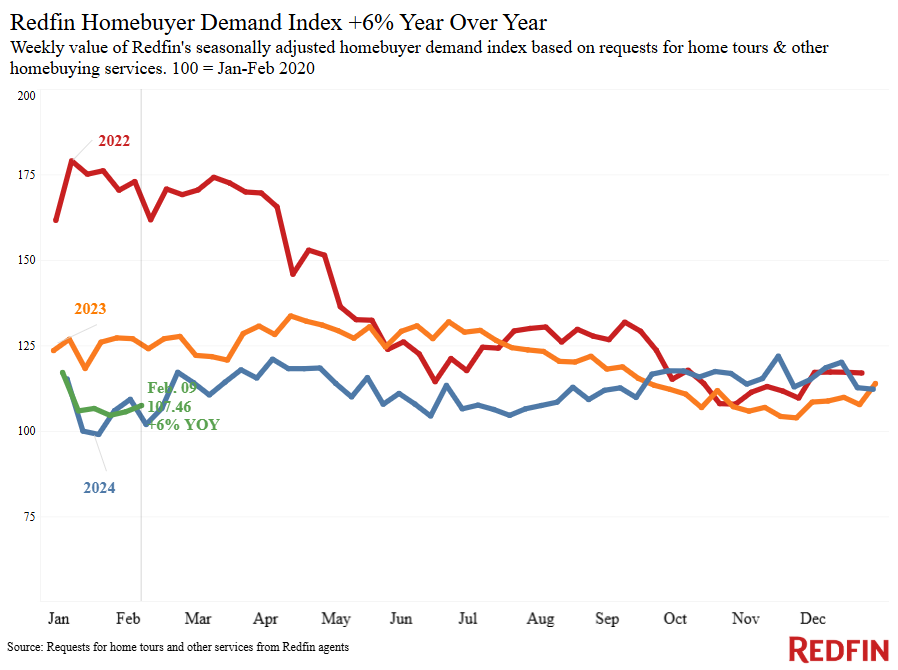
But more homebuyers may come out of the woodwork soon. Redfin’s Homebuyer Demand Index–a measure of tours and other buying services from Redfin agents–is up slightly from the six-month low it dropped to in late January, and agents report they’re seeing more house hunters.
“I’ve met with a lot of potential sellers over the last few weeks. Listings typically pick up in March or April, but this year it’s happening earlier,” said Fernanda Kriese, a Redfin Premier agent in Las Vegas. “Some of the sellers are listing because they bought just a few years ago and their home value isn’t increasing as quickly as they’d like, so they’re cutting their losses and moving to a less expensive home. Some are retirees who are downsizing. Buyers have been sidelined this year because of high mortgage rates and uncertainty surrounding politics and the economy, but some are starting to come off the fence.”
Redfin agents report uncertainty among buyers and sellers in areas with a lot of federal employees
Redfin agents in Washington, D.C. and other places with a high concentration of government workers report that the new presidential administration is impacting local housing markets. Return-to-office mandates for federal workers, and uncertainty about whether certain government employees will keep their job, are motivating some people to buy new homes, but discouraging others from buying or selling.
- “I recently worked with a couple who bought their dream home with me a few years ago, but now they’re considering listing because they want to be closer to public transportation. They both work for the government, and want a more convenient commute because they’ll need to return to in-person work soon.” –Stuart Naranch, Redfin Premier agent in Washington, D.C.
- “Since the inauguration, I’ve met with a few people, including one federal government employee, who are selling specifically because of anticipated return-to-office orders. I also spoke to a client who was looking to sell and upgrade to a larger home, but he canceled those plans because he’s worried about losing his job due to restructuring of government jobs.” –Jo Chavez, Redfin Premier agent in Kansas City, MO
Pending sales are ticking up in Los Angeles after wildfires
Pending home sales in the Los Angeles metro rose 3.4% year over year during the four weeks ending February 9, the first increase after five weeks of declines.
It’s possible the uptick stems from the Palisades and Eaton fires, which destroyed thousands of homes in the Los Angeles area in early January. Some affluent people who were displaced by the fires may be buying new homes. Please note that this is just one early data point; we will keep an eye on the Los Angeles market to see how pending sales and listings shake out over the next several months.
For Redfin economists’ takes on the housing market, please visit Redfin’s “From Our Economists” page.
Leading indicators
| Indicators of homebuying demand and activity | ||||
| Value (if applicable) | Recent change | Year-over-year change | Source | |
| Daily average 30-year fixed mortgage rate | 7.13% (Feb. 12) | Up from 6.99% a week earlier to highest level in a month | Up from 6.97% | Mortgage News Daily |
| Weekly average 30-year fixed mortgage rate | 6.89% (week ending Feb. 6) | Down from 7.04% 3 weeks earlier | Up from 6.64% | Freddie Mac |
| Mortgage-purchase applications (seasonally adjusted) | Down 2% from a week earlier (as of week ending Feb. 7) | Up 2% | Mortgage Bankers Association | |
| Redfin Homebuyer Demand Index (seasonally adjusted) | Up 3% from late January’s 6-month low
(as of week ending Feb. 9) |
Up 6% | Redfin Homebuyer Demand Index, a measure of tours and other homebuying services from Redfin agents | |
| Touring activity | Up 13% from the start of the year (as of Feb. 10) | At this time last year, it was up 17% from the start of 2024 | ShowingTime, a home touring technology company | |
| Google searches for “home for sale” | Essentially unchanged from a month earlier (as of Feb. 10) | Essentially unchanged | Google Trends | |
Key housing-market data
| U.S. highlights: Four weeks ending Feb. 9, 2025
Redfin’s national metrics include data from 400+ U.S. metro areas, and are based on homes listed and/or sold during the period. Weekly housing-market data goes back through 2015. Subject to revision. |
|||
| Four weeks ending Feb. 9, 2025 | Year-over-year change | Notes | |
| Median sale price | $375,750 | 4.3% | |
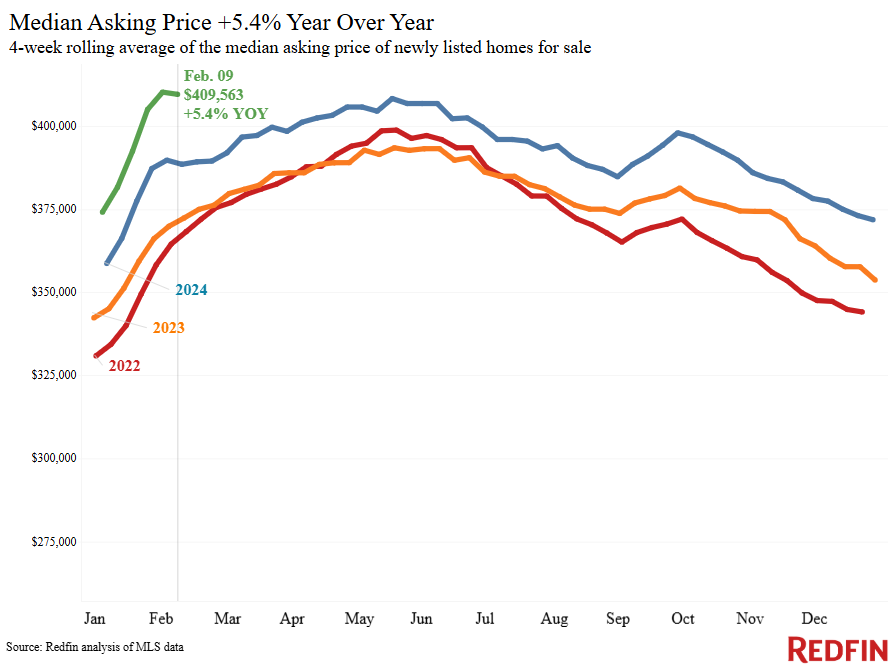
| Median asking price | $409,563 | 5.4% | |
| Median monthly mortgage payment | $2,753 at a 6.89% mortgage rate | 6.4% | $46 shy of all-time high |
| Pending sales | 70,008 | -6% | |
| New listings | 78,828 | 7.4% | Biggest increase in 6 weeks |
| Active listings | 902,657 | 11.1% | Smallest increase in nearly a year |
| Months of supply | 5 | +0.6 pts. to longest span since early 2019 (tied with 4 weeks ending Jan. 19 and Jan. 26) | 4 to 5 months of supply is considered balanced, with a lower number indicating seller’s market conditions |
| Share of homes off market in two weeks | 31.3% | Down from 34% | |
| Median days on market | 57 | +7 days to longest span since March 2020 | |
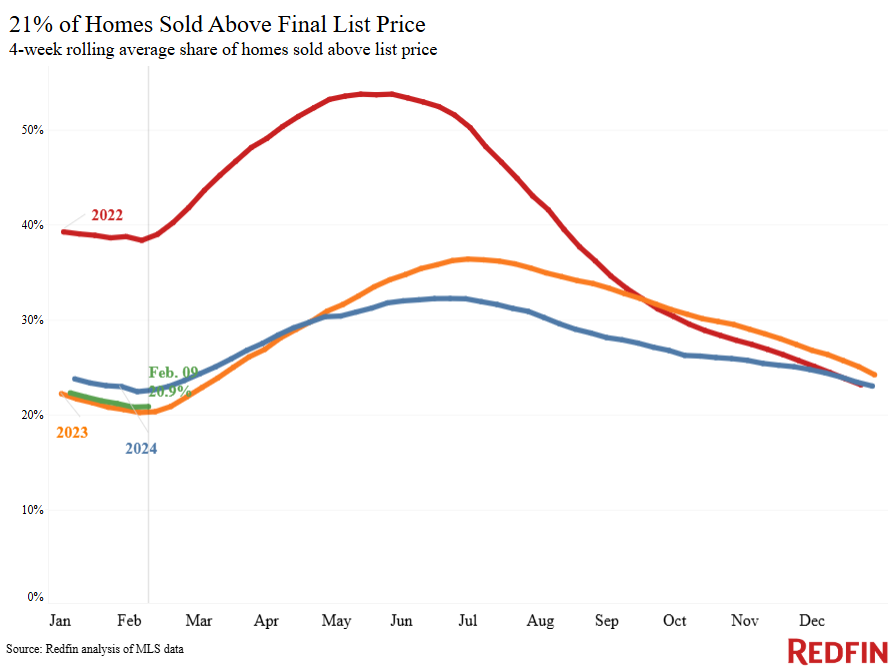
| Share of homes sold above list price | 20.9% | Down from 23% | |
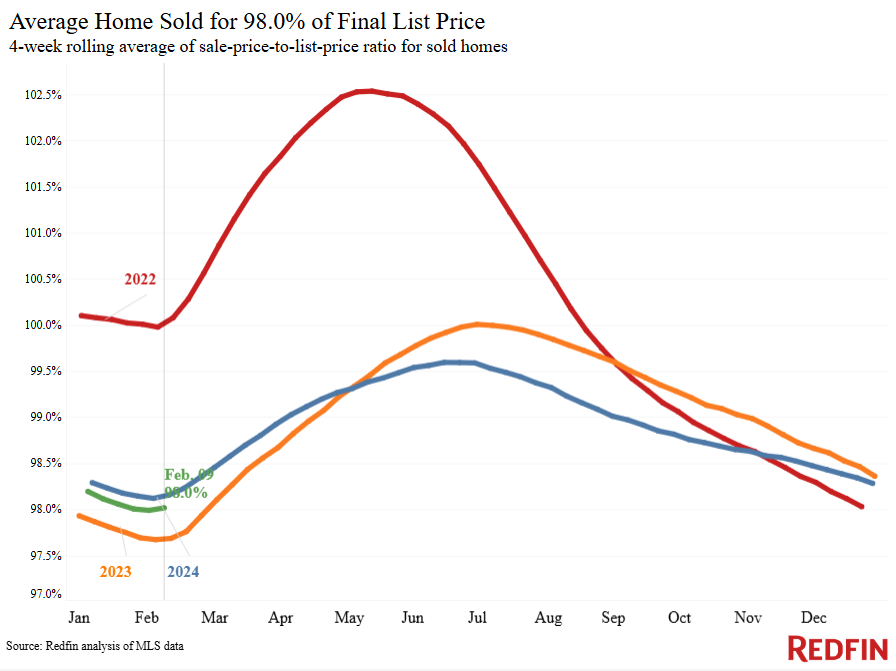
| Average sale-to-list price ratio | 98% | Down from 98.1% | |
|
Metro-level highlights: Four weeks ending Feb. 9, 2025 Redfin’s metro-level data includes the 50 most populous U.S. metros. Select metros may be excluded from time to time to ensure data accuracy. |
|||
|---|---|---|---|
| Metros with biggest year-over-year increases | Metros with biggest year-over-year decreases |
Notes |
|
| Median sale price | Pittsburgh (14.8%)
Nassau County, NY (12.2%) West Palm Beach, FL (11.5%) New Brunswick, NJ (11%) Cincinnati, OH (10.8%) |
Austin, TX (-4.5%)
Tampa, FL (-2.1%) Warren, MI (-0.2%) Jacksonville, FL (-0.1%) |
Declined in 4 metros |
| Pending sales | Oakland, CA (47.9%)
San Francisco (28%) Portland, OR (12.5%) Milwaukee (5.2%) Anaheim, CA (4.9%) Los Angeles (3.4%) |
Miami (-23.9%)
Houston (-19.5%) Atlanta (-19.4%) Jacksonville, FL (-18.4%) San Antonio (-16.9%) |
Increased in 6 metros |
| New listings | San Jose, CA (32.8%)
Oakland, CA (32.3%) Phoenix (23.2%) Los Angeles (23%) Nashville, TN (21.6%) |
Detroit (-20.9%)
Warren, MI (-13.6%) New York (-12.9%) Newark, NJ (-10.6%) Chicago (-9.4%) |
Declined in 17 metros |
Refer to our metrics definition page for explanations of all the metrics used in this report.
Written by: Dana Anderson