

Nationwide, the median asking rent was little changed from a year earlier, down 0.1% to $1,599. But rents may inch up if demand outstrips supply in a big way, which is feasible because apartment construction is slowing and high homebuying costs are fueling renter demand.
The median U.S. asking rent was $1,599 in January, little changed (-0.1%) from a year earlier and up 0.5% from a month earlier.
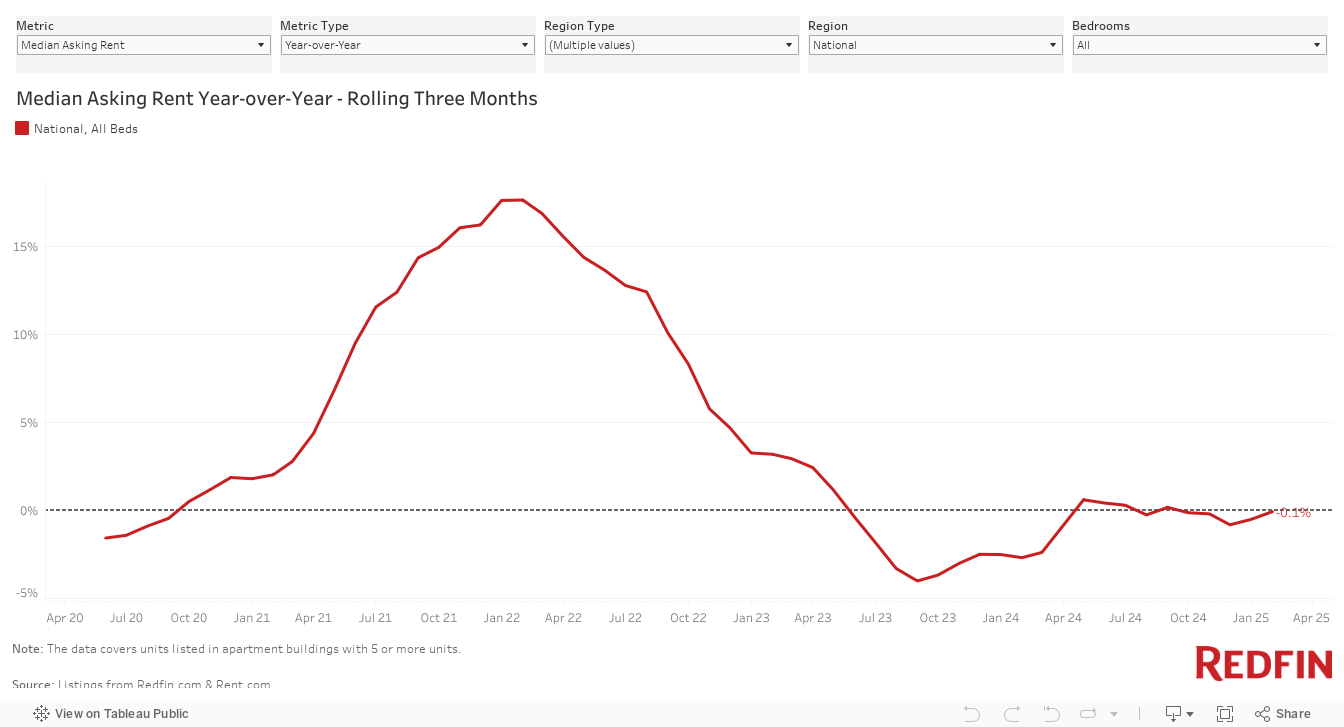
The median asking rent per square foot fell 1.5% year over year to $1.80 and rose 0.8% month over month.
Rents are stabilizing because the number of available apartments is in sync with the number of people who want to rent those apartments. Asking rents skyrocketed during the pandemic moving frenzy because there weren’t enough apartments to go around, then dipped in 2023 and early 2024 because builders ramped up construction to meet newfound demand. Now, the number of new apartments hitting the market is tapering off, and demand, while strong, isn’t going gangbusters like it was during the pandemic.
“Rental supply and demand are in lockstep, which is keeping rent growth at bay, but that may not last long,” said Redfin Senior Economist Sheharyar Bokhari. “Apartment construction could be further hampered by new tariffs on building materials. At the same time, demand for apartments continues to grow as high mortgage rates and housing prices push homeownership out of reach for many Americans. Rents will tick up if demand starts to outpace supply in a meaningful way.”
In Austin, asking rents are now $400 below their all-time high
In Austin, TX, the median asking rent dropped 16% year over year in January to $1,399—the largest decline among the 44 major U.S. metropolitan areas Redfin analyzed. It’s now 22.2% ($400) below its $1,799 August 2023 record high.
Tampa, FL was home to the second largest decline (-8.2%), followed by Salt Lake City (-6.5%), Jacksonville, FL (-6.4%) and New York (-5%).
Asking rents are falling quickly in parts of Texas and Florida because those states have been building more housing than other states. Florida has also been grappling with intensifying natural disasters, which has made some people hesitant to live there.
Rents rose most in Cincinnati (15%), Providence, RI (13.4%), Louisville, KY (10.5%), Baltimore (10.2%) and Washington, D.C. (8.8%).
Asking rents are down across all apartment types, with 3+ bedrooms seeing the biggest drop
Asking rents fell across all bedroom counts for the seventh consecutive month in January.
The median asking rent for 3+ bedroom apartments dropped 1.7% year over year to $1,966. For 0-1 bedroom apartments, it fell 0.6% to $1,458, and for 2 bedroom apartments, it declined 0.4% to $1,674.

In Los Angeles, asking rents rise for 3+ bedroom apartments amid wildfires
There have been news reports of rental price gouging in the wake of the Los Angeles wildfires amid a surge in rental demand from displaced families. Overall, the median asking rent in the Los Angeles metro area was flat from a year earlier in January, at $2,780. The median asking rent for 3+ bedroom Los Angeles apartments, however, did tick up. It rose 3.9% year over year—the biggest increase since November 2023—to $3,950. Though it’s worth noting that 3+ bedroom rents in Los Angeles were already starting to inch up prior to the fires. By comparison, asking rents for 0-1 bedroom Los Angeles apartments rose 0.6% year over year to $2,489, and asking rents for 2 bedroom apartments rose 0.8% to $3,175.
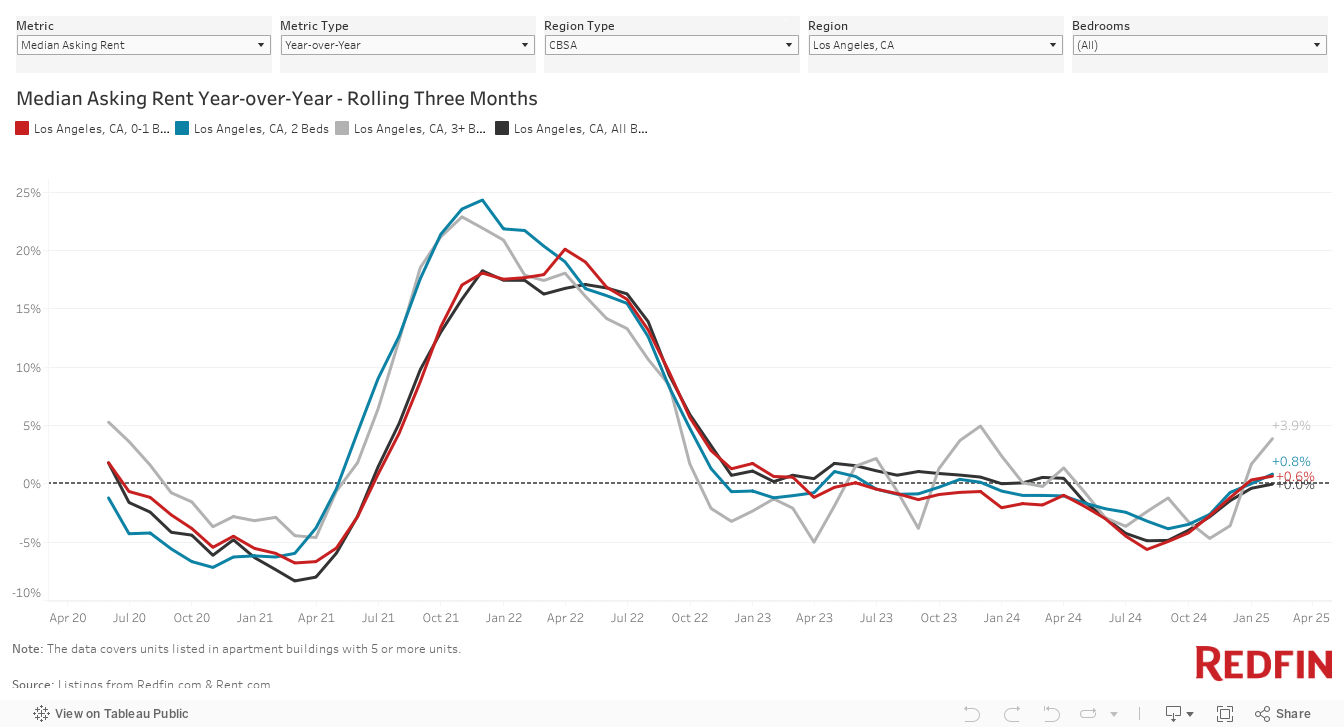
Los Angeles has the third highest overall median asking rent in the country, meaning many renters still have a hard time finding affordable apartments even though rents aren’t much different than they were a year ago.
Metro-Level Summary: January 2025
| U.S. metro area | Median asking rent | YoY change in median asking rent | MoM change in median asking rent | Median asking rent per square foot | YoY change in median asking rent per square foot | MoM change in median asking rent per square foot |
|---|---|---|---|---|---|---|
| Atlanta, GA | $1,526 | 1.7% | 0.1% | $1.56 | -0.9% | 0.3% |
| Austin, TX | $1,399 | -16.0% | 0.6% | $1.62 | -16.9% | 2.0% |
| Baltimore, MD | $1,600 | 10.2% | 0.0% | $1.73 | 6.9% | 0.9% |
| Birmingham, AL | $1,353 | 1.0% | 0.3% | $1.31 | 0.9% | -0.9% |
| Boston, MA | $2,693 | 7.0% | 1.7% | $3.09 | 0.6% | 1.5% |
| Buffalo, NY | $1,285 | 5.3% | -1.9% | $1.67 | 2.3% | -0.6% |
| Charlotte, NC | $1,480 | 0.3% | 0.3% | $1.57 | -1.1% | 0.7% |
| Chicago, IL | $1,707 | 7.0% | 0.2% | $2.17 | 4.8% | 2.1% |
| Cincinnati, OH | $1,420 | 15.0% | 4.4% | $1.56 | 7.3% | 1.1% |
| Cleveland, OH | $1,290 | 8.4% | 0.8% | $1.45 | 5.3% | 2.3% |
| Columbus, OH | $1,395 | 4.8% | -0.3% | $1.54 | 9.0% | -0.8% |
| Dallas, TX | $1,464 | -3.6% | 0.3% | $1.75 | -1.1% | 0.5% |
| Denver, CO | $1,685 | -2.6% | -0.3% | $2.07 | -5.9% | -0.3% |
| Detroit, MI | $1,330 | 0.4% | -1.2% | $1.52 | 3.8% | 0.3% |
| Houston, TX | $1,235 | 0.5% | 0.4% | $1.43 | -4.9% | 0.7% |
| Indianapolis, IN | $1,375 | 3.5% | 1.6% | $1.52 | 6.5% | 2.2% |
| Jacksonville, FL | $1,459 | -6.4% | 0.3% | $1.55 | -2.2% | 0.6% |
| Las Vegas, NV | $1,470 | -1.3% | 1.7% | $1.64 | -1.6% | 0.0% |
| Los Angeles, CA | $2,780 | 0.0% | 0.0% | $3.37 | 2.2% | 0.4% |
| Louisville/Jefferson County, KY | $1,249 | 10.5% | 1.6% | $1.36 | 13.3% | 0.0% |
| Memphis, TN | $1,204 | 3.1% | 0.4% | $1.22 | 1.5% | 0.5% |
| Miami, FL | $2,390 | 1.9% | 0.9% | $2.48 | 2.1% | 0.6% |
| Minneapolis, MN | $1,540 | -4.6% | 0.3% | $1.89 | -1.9% | -0.2% |
| Nashville, TN | $1,519 | -4.7% | 1.6% | $1.73 | 0.1% | 2.4% |
| New York, NY | $2,827 | -5.0% | 1.0% | $3.52 | -2.7% | 1.8% |
| Orlando, FL | $1,733 | -1.5% | 1.3% | $1.81 | -3.2% | 0.5% |
| Philadelphia, PA | $1,855 | -0.8% | -0.3% | $2.16 | -3.1% | 0.5% |
| Phoenix, AZ | $1,475 | -1.3% | 0.1% | $1.77 | -0.5% | 1.0% |
| Pittsburgh, PA | $1,410 | -0.7% | 2.5% | $1.70 | 3.3% | 1.5% |
| Portland, OR | $1,760 | -3.6% | 0.6% | $2.01 | -6.1% | -0.9% |
| Providence, RI | $2,148 | 13.4% | 1.1% | $2.58 | 9.3% | 2.2% |
| Raleigh, NC | $1,410 | -4.7% | -1.2% | $1.50 | -2.4% | 0.2% |
| Richmond, VA | $1,573 | 2.9% | -0.4% | $1.72 | 1.7% | -0.1% |
| Riverside, CA | $2,292 | 2.8% | 1.4% | $2.61 | 4.9% | -0.2% |
| Sacramento, CA | $1,999 | 4.7% | 1.9% | $2.34 | -0.5% | -0.8% |
| Salt Lake City, UT | $1,476 | -6.5% | 0.0% | $1.81 | -8.4% | -0.6% |
| San Diego, CA | $2,693 | -3.3% | -4.7% | $3.24 | -1.8% | -3.7% |
| San Francisco, CA | $2,695 | -0.1% | 0.0% | $3.53 | -4.6% | -0.5% |
| San Jose, CA | $3,184 | 4.2% | 0.2% | $3.71 | 7.6% | 0.2% |
| Seattle, WA | $2,055 | 1.8% | 2.3% | $2.69 | -1.4% | 2.0% |
| St. Louis, MO | $1,236 | -1.5% | 0.9% | $1.45 | -0.5% | 1.8% |
| Tampa, FL | $1,729 | -8.2% | -0.4% | $1.93 | -3.0% | -2.7% |
| Virginia Beach, VA | $1,548 | 8.6% | -1.9% | $1.68 | 9.6% | -1.0% |
| Washington, D.C. | $2,050 | 8.8% | 0.6% | $2.35 | 10.5% | 0.1% |
| National | $1,599 | -0.1% | 0.5% | $1.80 | -1.5% | 0.8% |
Methodology
Median asking rent figures in this report cover newly listed units in apartment buildings with five or more units. The median is calculated based on a rolling three-month period, i.e., the median asking rent for January 2025 covers rentals that were listed on Rent.com and Redfin.com during the three months ending January 31, 2025.
Metro-level data in this report covers 44 of the 50 most populous U.S. core-based statistical areas (CBSAs)—those for which Rent. and Redfin have sufficient rental data. The national figures are based on data for the entire U.S.
Asking rents reflect the current costs of new leases during each time period. In other words, the amount shown as the median asking rent is not the median of what all renters are paying, but the median asking price of apartments that were available for new renters during the report period.
Written by: Lily Katz