
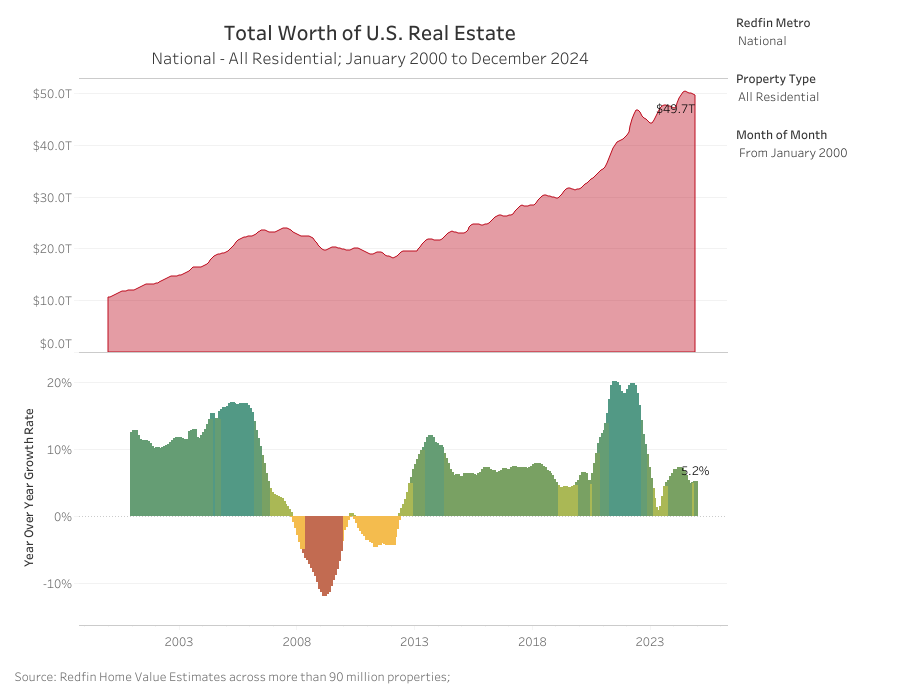
- The combined value of U.S. homes climbed to $49.7 trillion in 2024.
- The total value of homes owned by millennials grew to nearly $10 trillion, representing more than 20% of the U.S. market.
- Two upstate New York metros—Albany and Rochester—had the fastest growth in aggregate home value, while Florida metros grew more slowly.
- San Diego and Seattle look set to join eight other metros with homes worth $1 trillion in 2025.
The combined value of U.S. homes gained $2.5 trillion in 2024 to reach $49.7 trillion.
This is according to an analysis of the Redfin Estimate for more than 98 million U.S. residential properties as of December 31, 2024. This data is subject to revision.
In percentage terms, the total value of the U.S. housing market grew 5.2% year over year. That was the slowest growth in a calendar year since 2019 and the second-slowest since 2011.
“There are more homes for sale right now than in recent years and that has led to buyer’s markets in many areas of the country. That’s good news, but it doesn’t mean homes are getting cheaper—prices continue to tick up each month,” said Redfin Economics Research Lead Chen Zhao. “We expect prices—and therefore home values—to keep rising steadily this year because there are still enough buyers competing over a relatively small number of listings, compared to before the pandemic.”
Still, the total value of the U.S. homes has more than doubled over the past decade, from $23 trillion in 2014.
The combined value of U.S. homes peaked at $50.4 trillion in July. The drop to $49.7 trillion is reflective of seasonal sales trends, with overall home values rising during the peak buying seasons between March and September and falling during the winter months when fewer properties are sold.
It’s worth noting that new construction also helps underpin the overall increase in market valuation. This analysis examined the Redfin Estimate for 98.91 million homes, compared to 98.03 million homes a year earlier.
Major metros in upstate New York gained the most value in 2024
Major metros in the Northeast gained the most value in percentage terms in 2024, led by Albany and Rochester in upstate New York. Albany’s aggregate home value rose 11.3% to pass the $100 billion mark ($110.7 billion), while Rochester’s total value increased 11.2% to $124.3 billion.
The rising value can be attributed to a shortage of homes for sale in the region, which is driving prices up. Out of all major U.S. metros, Rochester has the lowest number of months of for-sale supply, while Albany has the eighth lowest.
The value of properties in Newark, NJ rose 11.1% to $410.8 billion, while another upstate New York metro Buffalo climbed 11% to $107.8 billion. Hartford, CT (up 10.6% to $140 billion) rounded out the five metros with the highest gains.
Redfin examined the 100 most-populous metro areas and included the 95 that had sufficient data.
Only three metros recorded a fall in total home value, led by Cape Coral, FL, which dropped 2.9% to $199.5 billion. Next came North Port, FL (-1.1% to $247 billion) and Honolulu (-0.4% to $279.8 billion). West Palm Beach, FL (+0.3% to $471.7 billion) and Tampa, FL (+0.8% to $537.1 billion) rounded out the five major metros with the slowest growth.
Florida’s housing market faced multiple headwinds in 2024. The pandemic-driven construction boom increased housing supply, right as buyer demand slowed due to the relative lack of affordability compared to just a few years ago. On top of those impacts, natural disasters—including major hurricanes in October—have led to higher insurance costs and increased climate-related concerns for buyers.
San Diego and Seattle knock on door of trillion-dollar club
There are eight U.S. metros where the total value of homes tops $1 trillion, led by New York, which saw values rise 9.4% to $2.43 trillion in 2024.
San Diego and Seattle continue to knock on the door of the trillion-dollar club and look set to join the list in 2025, if home values keep increasing at a similar rate.
Millennials now own more than 20% of the U.S. home market
Millennials now own more than 20% of the U.S. home market, with their generation’s total home value rising 18.8% year over year to $9.7 trillion in the third quarter of 2024—the most recent period for which generational data is available. (Note: the Federal Reserve defines anyone born in 1981 or later as Millennials.)
The growth for millennials is due to a number of factors, including being the largest generation by population and having reached an age and financial position where they make up the largest share of the homebuying market.
The millennial generation’s growth is nearly four times faster than that of baby boomers, who saw their total home value grow 5.2% to $19.8 trillion. Boomers still own 41.1% of the total U.S. market, the largest share of any generation.
The value of homes owned by Gen X increased 4.6% to $14.1 trillion, while the Silent Generation home values fell 3.7% to $4.6 trillion.
Growth of rural home values outpaces suburban and urban homes for seventh consecutive year
Rural home values outpaced those in urban areas and the suburbs for the seventh consecutive year, jumping 6.4% year over year to $8.1 trillion. The total value of homes in urban areas rose 4.9% to $10.6 trillion, while the value of homes in the suburbs increased 5.1% to $30.8 trillion.
There are around 59 million homes in the suburbs, compared to 23 million in urban areas and 22 million in rural areas.
Metro-Level Home Value Summary: December 2024
The table below comes from a list of the 100 most populous metro areas, five of which were excluded due to insufficient data.
| U.S. metro area | Total value of homes | Total value of homes, YoY change (%) | Total value of homes, YoY change ($) |
|---|---|---|---|
| Akron, OH | $ 72,128,474,756 | 8.00% | $ 5,355,734,481 |
| Albany, NY | $ 110,590,278,654 | 11.30% | $ 11,213,529,260 |
| Allentown, PA | $ 111,055,303,798 | 9.30% | $ 9,453,928,351 |
| Anaheim, CA | $ 1,128,528,614,433 | 7.80% | $ 81,459,932,337 |
| Atlanta, GA | $ 1,286,012,769,494 | 3.30% | $ 40,837,449,529 |
| Austin, TX | $ 398,274,085,646 | 2.80% | $ 10,761,489,542 |
| Bakersfield, CA | $ 87,690,840,034 | 3.50% | $ 2,984,154,690 |
| Baltimore, MD | $ 426,066,850,073 | 4.30% | $ 17,718,709,766 |
| Baton Rouge, LA | $ 78,028,866,500 | 6.60% | $ 4,813,351,384 |
| Birmingham, AL | $ 115,948,726,166 | 4.20% | $ 4,658,650,630 |
| Boise City, ID | $ 129,400,420,258 | 5.50% | $ 6,705,351,546 |
| Boston, MA | $ 1,282,533,441,634 | 5.00% | $ 61,441,677,456 |
| Bridgeport, CT | $ 224,607,277,413 | 7.80% | $ 16,168,559,456 |
| Buffalo, NY | $ 107,787,802,139 | 11.00% | $ 10,647,528,048 |
| Camden, NJ | $ 164,079,948,044 | 8.90% | $ 13,435,846,345 |
| Cape Coral, FL | $ 199,485,736,113 | -2.90% | $ (5,882,226,048) |
| Charleston, SC | $ 195,082,343,335 | 7.40% | $ 13,507,808,661 |
| Charlotte, NC | $ 489,622,385,659 | 5.40% | $ 24,971,921,354 |
| Chicago, IL | $ 1,071,201,960,493 | 7.60% | $ 75,859,816,293 |
| Cincinnati, OH | $ 250,237,699,830 | 7.90% | $ 18,312,268,699 |
| Cleveland, OH | $ 212,660,407,904 | 8.00% | $ 15,745,003,089 |
| Colorado Springs, CO | $ 118,124,413,320 | 3.30% | $ 3,730,390,445 |
| Columbia, SC | $ 83,045,295,599 | 5.40% | $ 4,232,434,245 |
| Columbus, OH | $ 272,777,872,579 | 8.50% | $ 21,451,329,718 |
| Dallas, TX | $ 746,510,157,173 | 2.90% | $ 21,352,595,658 |
| Dayton, OH | $ 64,648,119,368 | 8.60% | $ 5,136,762,743 |
| Denver, CO | $ 682,320,178,276 | 2.60% | $ 17,345,958,239 |
| Des Moines, IA | $ 65,884,842,170 | 7.60% | $ 4,653,842,767 |
| Detroit, MI | $ 150,236,261,683 | 7.20% | $ 10,116,222,331 |
| El Paso, TX | $ 59,515,081,077 | 2.10% | $ 1,236,747,003 |
| Elgin, IL | $ 86,351,553,525 | 9.40% | $ 7,430,008,677 |
| Fort Lauderdale, FL | $ 394,606,156,983 | 1.80% | $ 6,954,993,217 |
| Fort Worth, TX | $ 299,289,931,274 | 2.40% | $ 6,895,112,341 |
| Frederick, MD | $ 301,120,787,066 | 7.30% | $ 20,509,996,324 |
| Fresno, CA | $ 104,858,662,236 | 4.70% | $ 4,716,253,540 |
| Grand Rapids, MI | $ 145,515,725,532 | 8.30% | $ 11,116,954,481 |
| Greensboro, NC | $ 72,023,667,024 | 5.20% | $ 3,572,658,169 |
| Greenville, SC | $ 116,537,349,948 | 4.70% | $ 5,190,254,876 |
| Hartford, CT | $ 140,042,991,414 | 10.60% | $ 13,434,469,527 |
| Honolulu, HI | $ 279,754,294,552 | -0.40% | $ (1,168,201,027) |
| Houston, TX | $ 801,227,007,404 | 2.20% | $ 16,973,982,847 |
| Jacksonville, FL | $ 260,126,729,576 | 2.40% | $ 6,038,537,546 |
| Kansas City, MO | $ 127,434,005,156 | 5.40% | $ 6,537,435,069 |
| Knoxville, TN | $ 133,101,833,371 | 7.00% | $ 8,719,742,787 |
| Lake County, IL | $ 132,811,140,660 | 8.30% | $ 10,213,466,047 |
| Lakeland, FL | $ 84,444,924,968 | 2.30% | $ 1,879,321,365 |
| Las Vegas, NV | $ 433,715,991,076 | 7.20% | $ 29,087,782,866 |
| Little Rock, AR | $ 66,666,064,419 | 9.00% | $ 5,492,164,719 |
| Los Angeles, CA | $ 2,176,922,728,723 | 2.10% | $ 45,440,430,438 |
| Louisville, KY | $ 98,458,077,891 | 9.20% | $ 8,318,092,295 |
| McAllen, TX | $ 46,416,461,630 | 2.70% | $ 1,241,335,891 |
| Memphis, TN | $ 96,324,709,097 | 5.60% | $ 5,125,233,344 |
| Miami, FL | $ 587,327,597,535 | 6.80% | $ 37,617,307,680 |
| Milwaukee, WI | $ 183,724,093,624 | 9.10% | $ 15,391,682,050 |
| Minneapolis, MN | $ 549,401,556,026 | 3.40% | $ 17,841,454,055 |
| Montgomery County, PA | $ 371,821,663,186 | 6.50% | $ 22,712,529,386 |
| Nashville, TN | $ 384,210,496,588 | 5.70% | $ 20,767,612,222 |
| Nassau County, NY | $ 793,610,274,756 | 8.90% | $ 64,580,855,370 |
| New Brunswick, NJ | $ 619,607,416,751 | 10.30% | $ 57,803,484,671 |
| New Haven, CT | $ 91,741,852,804 | 9.40% | $ 7,865,504,589 |
| New Orleans, LA | $ 129,095,796,228 | 4.20% | $ 5,185,937,630 |
| New York, NY | $ 2,425,739,855,238 | 9.40% | $ 207,902,385,088 |
| Newark, NJ | $ 410,849,778,351 | 11.10% | $ 41,194,352,143 |
| North Port, FL | $ 246,985,967,566 | -1.10% | $ (2,717,384,971) |
| Oakland, CA | $ 893,757,920,936 | 1.80% | $ 16,125,339,467 |
| Oklahoma City, OK | $ 149,284,333,983 | 6.00% | $ 8,437,099,659 |
| Orlando, FL | $ 444,805,542,784 | 2.60% | $ 11,245,324,080 |
| Oxnard, CA | $ 213,532,291,926 | 2.80% | $ 5,874,212,569 |
| Philadelphia, PA | $ 239,073,152,556 | 9.30% | $ 20,434,026,853 |
| Phoenix, AZ | $ 1,050,150,002,918 | 2.60% | $ 27,079,333,693 |
| Pittsburgh, PA | $ 218,319,787,046 | 8.90% | $ 17,774,540,388 |
| Portland, OR | $ 484,199,672,774 | 2.70% | $ 12,516,056,698 |
| Providence, RI | $ 99,355,963,176 | 7.10% | $ 6,577,054,666 |
| Raleigh, NC | $ 269,952,695,607 | 5.00% | $ 12,746,320,776 |
| Richmond, VA | $ 226,057,461,490 | 7.70% | $ 16,065,227,146 |
| Riverside, CA | $ 803,430,835,606 | 5.30% | $ 40,745,682,666 |
| Rochester, NY | $ 124,306,345,033 | 11.20% | $ 12,552,114,927 |
| Sacramento, CA | $ 460,774,069,753 | 3.60% | $ 16,103,235,876 |
| San Antonio, TX | $ 297,216,515,453 | 2.30% | $ 6,730,253,823 |
| San Diego, CA | $ 990,959,272,264 | 6.50% | $ 60,121,631,255 |
| San Francisco, CA | $ 692,359,715,076 | 4.30% | $ 28,434,417,143 |
| San Jose, CA | $ 872,422,996,528 | 6.10% | $ 49,851,074,882 |
| Seattle, WA | $ 939,106,345,974 | 5.70% | $ 50,879,805,125 |
| St. Louis, MO | $ 268,329,878,402 | 5.60% | $ 14,340,287,702 |
| Stockton, CA | $ 112,561,917,002 | 5.50% | $ 5,891,469,143 |
| Tacoma, WA | $ 163,343,386,143 | 2.30% | $ 3,668,878,549 |
| Tampa, FL | $ 537,104,739,623 | 0.80% | $ 4,225,311,755 |
| Tucson, AZ | $ 145,081,722,876 | 2.20% | $ 3,162,638,427 |
| Tulsa, OK | $ 94,232,483,171 | 5.90% | $ 5,268,025,257 |
| Virginia Beach, VA | $ 239,719,517,900 | 7.20% | $ 16,047,609,546 |
| Warren, MI | $ 372,326,559,992 | 7.60% | $ 26,151,976,782 |
| Washington, DC | $ 1,050,102,365,631 | 5.80% | $ 57,737,933,641 |
| West Palm Beach, FL | $ 471,745,502,390 | 0.30% | $ 1,438,201,664 |
| Wilmington, DE | $ 80,656,130,450 | 3.70% | $ 2,865,507,656 |
| Worcester, MA | $ 166,226,519,015 | 6.70% | $ 10,471,675,651 |
| National | $ 49,682,789,576,006 | 5.20% | $ 2,474,136,310,007 |
Methodology
This analysis estimated current (December 2024) home values using the Redfin Estimate, MLS data and public records. The Redfin Estimate covers more than 98 million single-family homes, condos, townhouses and 2-4 unit multifamily properties, and is available in most but not all parts of the U.S. Historical values were imputed using public records and MLS data on price per square foot trends by zip code (or city, county or state when zip-code data was insufficient). Both existing homes and new-construction homes are included in this dataset, which dates back to the year 2000. Homes are not added to the dataset until they are first built or sold.
Homes are determined to be rural, suburban or urban based on categories for the census tract of the property from the U.S. Department of Housing and Urban Development (HUD). HUD has a model that describes neighborhood types based on responses to the 2017 American Housing Survey.
Written by: Mark Worley