According to a recent release, the U.S. Department of Housing and Urban Development’s headquarters building in Washington, D.C., is facing over $500 million in deferred maintenance and modernization needs. In light of this, they have added the HUD headquarters building to the accelerated disposition list in order to engage the market and explore relocation options. They say the effort aligns with the Trump Administration’s broader strategy to streamline federal operations, eliminate waste, and ensure government work-spaces reflect improved standards for performance, efficiency, and morale. They are working with the U.S. General Services Administration (GSA) to facilitate the process. “HUD’s focus is on creating a workplace that reflects the values of efficiency, accountability, and purpose,” said Secretary Scott Turner. “We’re committed to rightsizing government operations and ensuring our facilities support a culture of optimal performance and exceptional service as we collaborate with our partners at GSA to deliver results for the …
Monthly Mortgage Payments Are Falling in 12 of the 50 Most Populous U.S. Metros, Mostly in the Bay Area, Florida and Texas
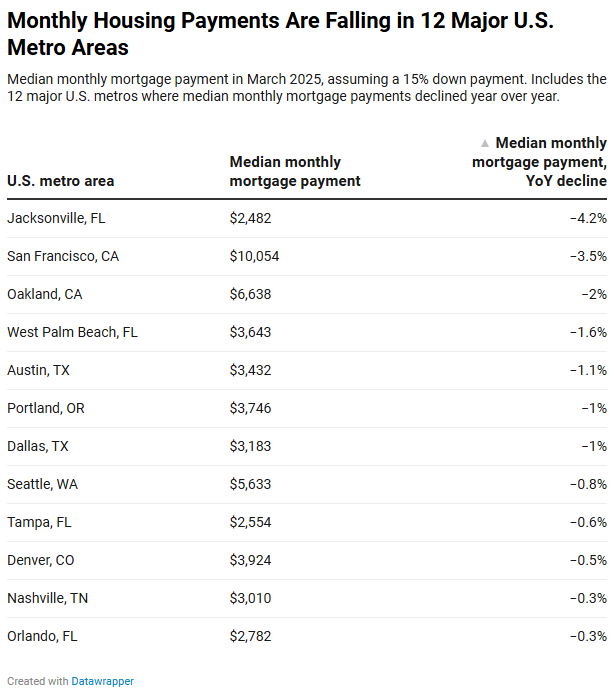
Monthly mortgage payments are declining in some parts of the country as homebuying demand slows amid widespread economic uncertainty. The silver lining for buyers in those places: They have some negotiating power. Monthly mortgage payments are declining in 12 of the 50 most populous U.S. metro areas, half of them in Florida or Texas. The typical homebuyer in Jacksonville, FL had a monthly mortgage payment of $2,482 in March, down 4.2% from a year earlier—the biggest decline among the metros in this analysis. The next-biggest declines were in the Bay Area: San Francisco, with a 3.5% decline to $10,054, and Oakland, with a 2% decline to $6,638. Other West Coast metros including Seattle and Portland, OR are also among the places where monthly mortgage payments are falling, as are three more Florida metros and a pair of Texas metros. This is from a Redfin analysis of the 50 most populous …
First Time at a REIA Meeting – How One Night Shifted a Real Estate Strategy
On a recent episode of the Rent Perfect podcast David Pickron flips the script and invites longtime behind-the-scenes team member Kent to share his very first experience attending a REIA (Real Estate Investor Association) meeting. This is a must-listen for for new investors, REIA members, and anyone serious about growing in real estate! “From walking into the packed AZREIA event to having “aha” moments during the market update and networking with investors, Kent explains how one evening opened his eyes to the power of connections, strategy, and local market knowledge.” Click here to listen. The post First Time at a REIA Meeting – How One Night Shifted a Real Estate Strategy appeared first on Real Estate Investing Today.
The Best Time to Sell a Home is in May
New study shows home sellers see 9.5 percent premium in May; Annual analysis also looks at best days to sell a home IRVINE, Calif. – April 30, 2025 – ATTOM, a leading curator of land, property data, and real estate analytics, today released its annual analysis of the best days of the year to sell a home, which shows that based on home sales over the past 10 years, the months of May, February and April offer the highest seller premiums – making this month the time to sell your home. An analysis of more than 47 million single-family home and condo sales between 2015 and 2024 reveals that listing a property in May, February, or April tends to generate the highest seller premiums. The data indicates that the early months of the year not only mark peak home-buying activity but also offer prime opportunities for sellers. For those considering …
Cotality SFRI: Rent Up 2.9% Year-Over Year in February
According to the latest Cotality (formerly CoreLogic) Single-Family Rent Index (SFRI), U.S. single-family home rental prices increased 2.9% year over year in February, 2025. The monthly growth rate for February was 1%, which was above the average of 0.2% for February from 2004-2019, marking the second consecutive month since mid-2024 that monthly growth has been above the seasonal trend. Rent prices for high-end properties increased 3.7% year over year in February, with low-end rent prices increasing 2% year over year in February. “Single-family rent growth strengthened in February, continuing a trend of higher annual gains. The monthly increases in the single-family rent index were above the seasonal trend as well, which contrasts with those recorded by the home price index. While economic uncertainty may be putting a damper on the home purchase market, it may have the opposite effect on the rental market as renters may choose to stay put.” …
The Typical Home Seller Wants $39,000 More Than the Typical Buyer Is Willing to Pay
The $469,729 median asking price is 9% higher than the $431,057 median sale price—the largest gap since 2020. Market dynamics have shifted in favor of buyers, but sellers have been slow to adjust, which is why list and sale prices are diverging. The prices home sellers are asking for and the prices homebuyers are paying haven’t been this out of whack since the start of the pandemic. The typical home for sale is listed for 9% more (or $38,672) than the typical home is selling for—the biggest gap since May 2020. This is based on home listing and sale price data in March, when the typical newly-listed home had a price tag of $469,729—a record high. The typical home that sold last month fetched $431,057—below the June 2024 record high of $442,529. Redfin’s analysis of MLS data covers median sale prices of homes sold during a given month and median …
Airbnb’s Most Wishlisted Homes in all 50 States
Airbnb says with the summer travel season just around the corner, data shows that spontaneous trips and nearby travel are on the rise. Interestingly, their data show that trips booked less than a week before travel has been the fastest growing segment over the last three years – indicating a rise in spontaneous travel and last-minute trips. So, where are Airbnb’s top “wishlisted” rentals in all 50 states? Click on the map below to find out. Click on the map above to make it interactive Click here to read the full report at Airbnb. The post Airbnb’s Most Wishlisted Homes in all 50 States appeared first on Real Estate Investing Today.
ATTOM Webinar Summary – Mastering Location: How ATTOM Boundary Data Powers Precision
This ATTOM webinar features industry expert Sean Mooney, VP of Product Management, as he discusses how ATTOM’s boundary datasets are empowering businesses across a wide range of industries to improve decision-making and enhance user experiences. During the webinar, Sean explores the critical role of location precision in today’s data-driven world. He highlights how ATTOM’s neighborhood, school, and parcel boundary datasets provide the spatial context needed for smarter insights, more accurate property analysis, and seamless search experiences. He explains the importance of boundary data for real estate portals, direct marketing, risk assessment, policy decision-making, and more. Sean provides an in-depth look at ATTOM’s comprehensive boundary product family, which includes Census boundaries, ZIP Codes, Postal Cities, flood zones, and Canadian boundary products. He then delves into ATTOM’s Neighborhood Boundaries, explaining how they are carefully hand-digitized, organized into a four-level hierarchy, and designed to support hyperlocal search and analysis with unmatched accuracy. He …
Top 10 Housing Markets with Biggest Quarterly Increases in Profit Margins in Q1 2025
According to ATTOM’s recently released Q1 2025 U.S. Home Sales Report, homeowners earned an average profit margin of 50.2 percent on the sale of single-family homes and condos. This marks a decline of 3.2 percentage points from the previous quarter and 4.8 points from the same period in 2024. WATCH: ATTOM #figuresfriday Top 10 Housing Markets with Biggest Quarterly Increases in Profit Margins in Q1 2025 ATTOM’s latest home sales analysis reported that the national median profit margin on home sales has seen modest declines nearly every quarter since mid-2022, yet it continues to sit well above pre-pandemic levels. The report noted that while the national median home sale price has held steady at $355,000 for two consecutive quarters—just below its peak of $358,000 in Q3 2024—the median raw profit for sellers slipped by roughly 4 percent, falling from $124,000 in Q4 2024 to $119,000 in Q1 2025. Also according …
Home Prices Are Falling in 11 of the 50 Most Populous U.S. Metros, the Most in 19 Months
Nationwide, home prices are up 2.1% year over year, the slowest growth rate in nearly two years. The median home-sale price declined year over year in 11 of the 50 most populous U.S. metro areas during the four weeks ending April 20. The last time home prices dropped in that many metros was over a year and a half ago, in September 2023. Prices declined most in San Antonio (-3.7%), Oakland, CA (-3.5%), and Jacksonville, FL (-2.2%). The other places where prices fell were Phoenix, Austin, TX, Dallas, Orlando, Sacramento, CA, Fort Worth, TX, Portland, OR and Nashville, TN. Nationwide, the median home-sale price rose 2.1% year over year, the slowest growth rate since July 2023. Home prices are falling in many major metros–and price growth is decelerating nationally–because many house hunters are backing off, but the number of homes for sale is holding up. Home tours are slowing, mortgage-purchase …