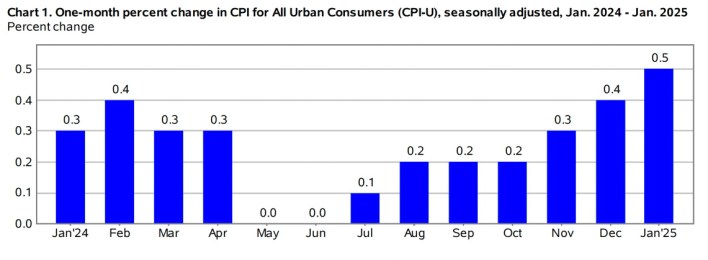
The U.S. Bureau of Labor Statistics is reporting that the Consumer Price Index for All Urban Consumers (CPI-U) increased 0.4% in January, 2025. The all items index was up 3% for the 12 months ending in January. The index for shelter rose 0.4% in January, accounting for nearly 30% of the monthly all items increase. BLS.gov Click here to read the full release at the Bureau of Labor Statistics. The post Inflation Up 3% Year-Over-Year appeared first on Real Estate Investing Today.
Client Connection: The Secret to Total Revenue Growth
A case study on how CoreLogic’s Marketing and Retention Solutions help mortgage brokers close more deals Like most mortgage companies, Empire Mortgage Corporation saw the value in customer retention. However, retaining customers has long been an experimental endeavor since it can be hard to predict exactly when to reach out. At least that was the case. Now, thanks to CoreLogic’s Marketing and Retention Solutions, Empire Mortgage Corporation gained the insights they needed to pick the exact right moment to reach out to past clients and build a client network with longevity. Marketing and Retention Solutions by CoreLogic The Challenge: Reconnecting With Clients For Michelle Chretien, CEO of Empire Mortgage Corporation, one of the biggest challenges was staying in touch with past clients and identifying high-intent leads before they were scooped up by competitors. The Focus: Strengthening Client Relationships With CoreLogic Marketing and Retention Solutions CoreLogic’s Marketing and Retention Solutions are designed …
U.S. States vs. G7 Countries by GDP per Capita
Last week we saw the most recent GDP numbers, but how do America’s richest and poorest states stack up to G7 countries when it comes to per capita GDP? Today’s graphic from the Visual Capitalist does just that by looking at the per capita GDP of these states and compares when with actual G7 countries. As always, stay safe and have a Happy Friday!!! “These massive gaps in output could be surprising for those not paying attention. The U.S. economy has surged since the pandemic, with its GDP per capita increasing by $20,000 between 2020 and 2024—a growth none of the other G7 countries have matched, even when going all the way back to 2010.” Hat tap to the Visual Capitalist. The post U.S. States vs. G7 Countries by GDP per Capita appeared first on Real Estate Investing Today.
Zumper’s National Rent Report for January ’25
Rental information site Zumper recently released their latest monthly National Rent Report for January, 2025. According to their data, median rent for 1-bedroom apartments was $1534 (down 0.3%) and $1,907 (up .01%) for two-bedrooms. Be sure to check out their list of the top 100 metro areas. Click here to read the full report at Zumper. The post Zumper’s National Rent Report for January ’25 appeared first on Real Estate Investing Today.
January Brought More Homes for Sale. Few Were Bought.
Housing supply rose to the highest level since 2020 in January, but housing demand fell to the lowest level since 2020 as mortgage rates hit an eight-month high. Sellers are making moves because they’re tired of waiting for mortgage rates to fall, but buyers are skittish amid economic uncertainty and rising home prices, which are up 4% from last year. The typical home that sold sat on the market for 56 days—the longest of any January since 2020. Homebuyers have the most options since 2020, but few are biting because rising housing costs have made monthly payments tough to swallow. Pending home sales in January fell to the lowest level on record aside from the start of the pandemic. They dropped 4.2% month over month—the largest decline on a seasonally adjusted basis since August 2023—and 6.3% year over year. Redfin’s records date back to 2012 unless otherwise noted. Meanwhile, active …
Housing Supply Is Piling Up As Home Sellers Enter the Market But Buyers Stay on Sidelines
New listings are up 7.4% from a year earlier, while pending sales are down 6%. Sales are slow mostly because of high home prices and mortgage rates. In Washington, D.C. and other places with a high concentration of government workers, Redfin agents report some buyers and sellers are changing plans due to uncertainty about their jobs. In Los Angeles, pending sales rose after five weeks of declines, possibly due to an influx of affluent buyers who lost their homes in recent wildfires. There are five months of for-sale supply on the market nationwide, up from 4.4 months a year earlier and the most since early 2019. Inventory is piling up because more sellers are listing their homes while fewer buyers are wading into the market. New listings rose 7.4% year over year during the four weeks ending February 9, hitting their highest level for any comparable time period since 2022. …
10 Markets Where Gen Z Can Buy a Home
Gen Z Homeownership is Highest in the Midwest for 2024 Gen Z accounted for 13% of home purchase applications. Midwest markets had a higher share of Gen Z homebuyers in 2024. Many Gen Z homebuyers are single, but about 45% of the applicants had co-applicants in 2024. The unprecedented rise in home prices and elevated mortgage rates that have dominated the market since 2021 have significantly impacted housing affordability, particularly for younger buyers. Despite these challenges, Gen Z is managing to enter the housing market. According to the CoreLogic Loan Application Database, this generation’s share of home-purchase applications accounted for 13% of total applications in 2024, a three-percentage point increase from 2023.1 Their presence in the market is expected to grow in the coming years. Where Can Gen Z Buy a Home? Gen Z represents a higher proportion of homebuyers in Midwestern markets but a lower proportion in more expensive …
How High are the Sales Taxes in Your State – 2025
Once again the Tax Foundation has published their annual list of sales taxes in each state. Sales taxes are a form of taxation that truly affects every person – it’s the classic consumption tax. It is also the one politicians often reach for first to ratchet-up to fund their next project du jour. That being said, the folks over at the Tax Foundation recently released their annual list showing the combined sales tax rates (state & local where applicable) for each state. The five states with the highest average combined state and local sales tax rates are Louisiana (10.12%), Tennessee (9.56%), Arkansas (9.46%), Washington (9.43%), and Alabama (9.43%). Be sure to look at their entire list to see how previous years’ data compares to 2025. !function(){“use strict”;window.addEventListener(“message”,(function(a){if(void 0!==a.data[“datawrapper-height”]){var e=document.querySelectorAll(“iframe”);for(var t in a.data[“datawrapper-height”])for(var r=0;r<e.length;r++)if(e[r].contentWindow===a.source){var i=a.data["datawrapper-height"][t]+"px";e[r].style.height=i}}}))}(); Click here to read the full report at the Tax Foundation. The post How High …
Redfin Welcomes More Than 140 New Agents in January
What a fantastic way to kick off the year! Redfin is excited to welcome over 140 talented agents who are ready to elevate their businesses with Redfin Next, and seize all of the opportunities this year will bring. Let’s give a warm welcome to our January Newfins—we can’t wait to see all you accomplish this year! Redfin agent Tamara Mattox-Kabat Among the new faces joining us is Redfin Premier agent Tamara Mattox-Kabat. She’s joining our Denver team with more than 16 years in the real estate industry, including time with Keller Williams, Compass and Zillow. With over $80 million in sales and a strong leadership background, Tamara brings a wealth of expertise, integrity, and positivity to every transaction. “The opportunity to build a team, collaborate with other top agents, and receive support from seasoned managers is so valuable. Redfin’s business model is unique because it covers most traditional expenses, unmatched …
Volatile Hotel Prices—Not Rents—Pushed January Inflation Numbers Higher
January’s inflation report came in hotter than expected, with the shelter category increasing 0.4%—up from 0.3% in recent months. While the overall shelter inflation component of CPI did tick up to a monthly increase of 0.4% from 0.3%, the increase was due to “lodging away from home”—meaning hotel prices—which jumped to 1.4%. The “lodging away from home” number is volatile: In the past three months it has ranged between -2.5% and January’s 1.4%. Despite the volatility, the “lodging away from home” component makes up only 3.6% of the overall shelter category and 1.292% of the total CPI figure. The more important rent of primary residence and owners’ equivalent rent categories—which include the rent that renters pay and homeowners could receive if they rented out their home instead of living in it—increased 0.3%, which is the same as increases in recent months. It is also true that the rent measures in …