

Foreclosure Starts See Quarterly Increase of 14 Percent; Bank Repossessions Up 8 Percent from Previous Quarter
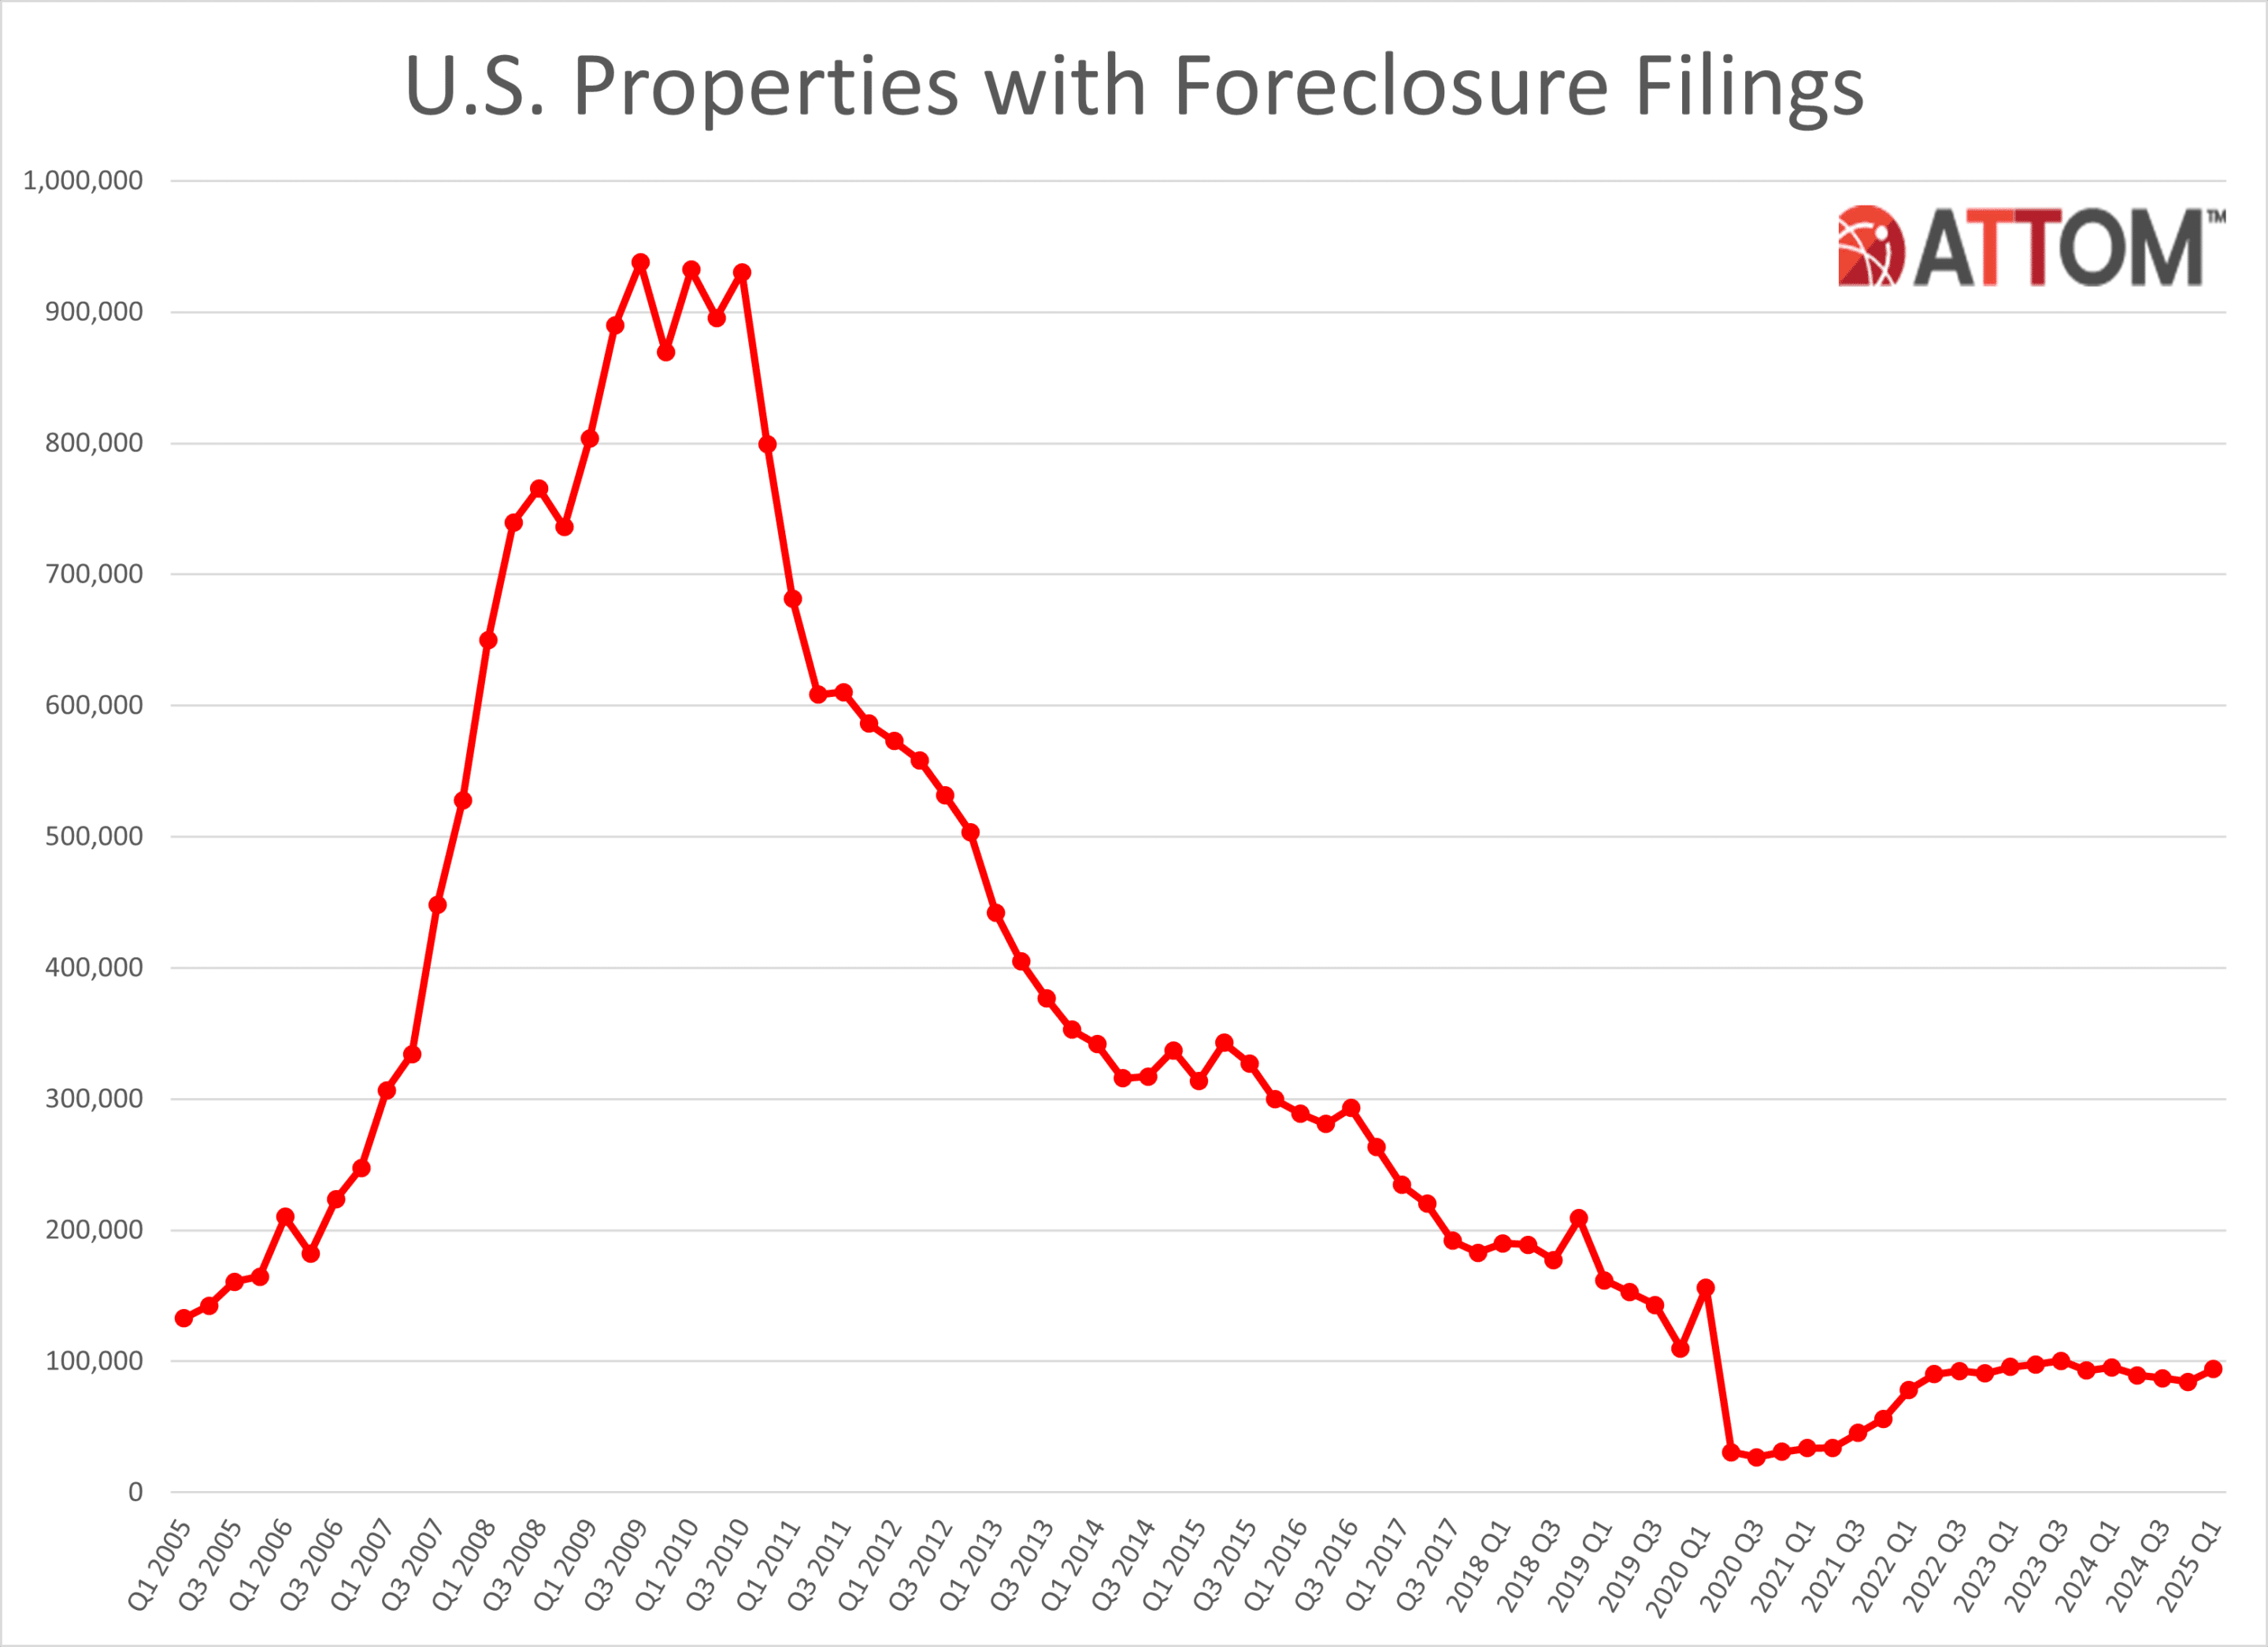
IRVINE, Calif. — April 10, 2025 — ATTOM, a leading curator of land, property, and real estate data, today released its Q1 2025 U.S. Foreclosure Market Report, which shows a total of 93,953 U.S. properties with a foreclosure filings during the first quarter of 2025, up 11 percent from the previous quarter but down 2 percent from a year ago.
The report also shows a total of 35,890 U.S. properties with foreclosure filings in March 2025, up 11 percent from the previous month and up 9 percent from a year ago.
“Following three consecutive quarters of decline, foreclosure activity ticked up in the first quarter of 2025, with notable growth in both starts and completions,” said Rob Barber, CEO at ATTOM. “While levels remain below historical averages, the quarterly growth suggests that some homeowners may be starting to feel the pressure of ongoing economic challenges. However, strong home equity positions in many markets continue to help buffer against a more significant spike in distress.”
Foreclosure starts increase nationwide
A total of 68,794 U.S. properties started the foreclosure process in Q1 2025, up 14 percent from the previous quarter and up 2 percent from a year ago.
States that had 100 or more foreclosures starts in Q1 2025 and saw the greatest annual increase included, Kansas (up 117 percent); Delaware (up 58 percent); Oklahoma (up 45 percent); Utah (up 42 percent); and Wyoming (up 33 percent).
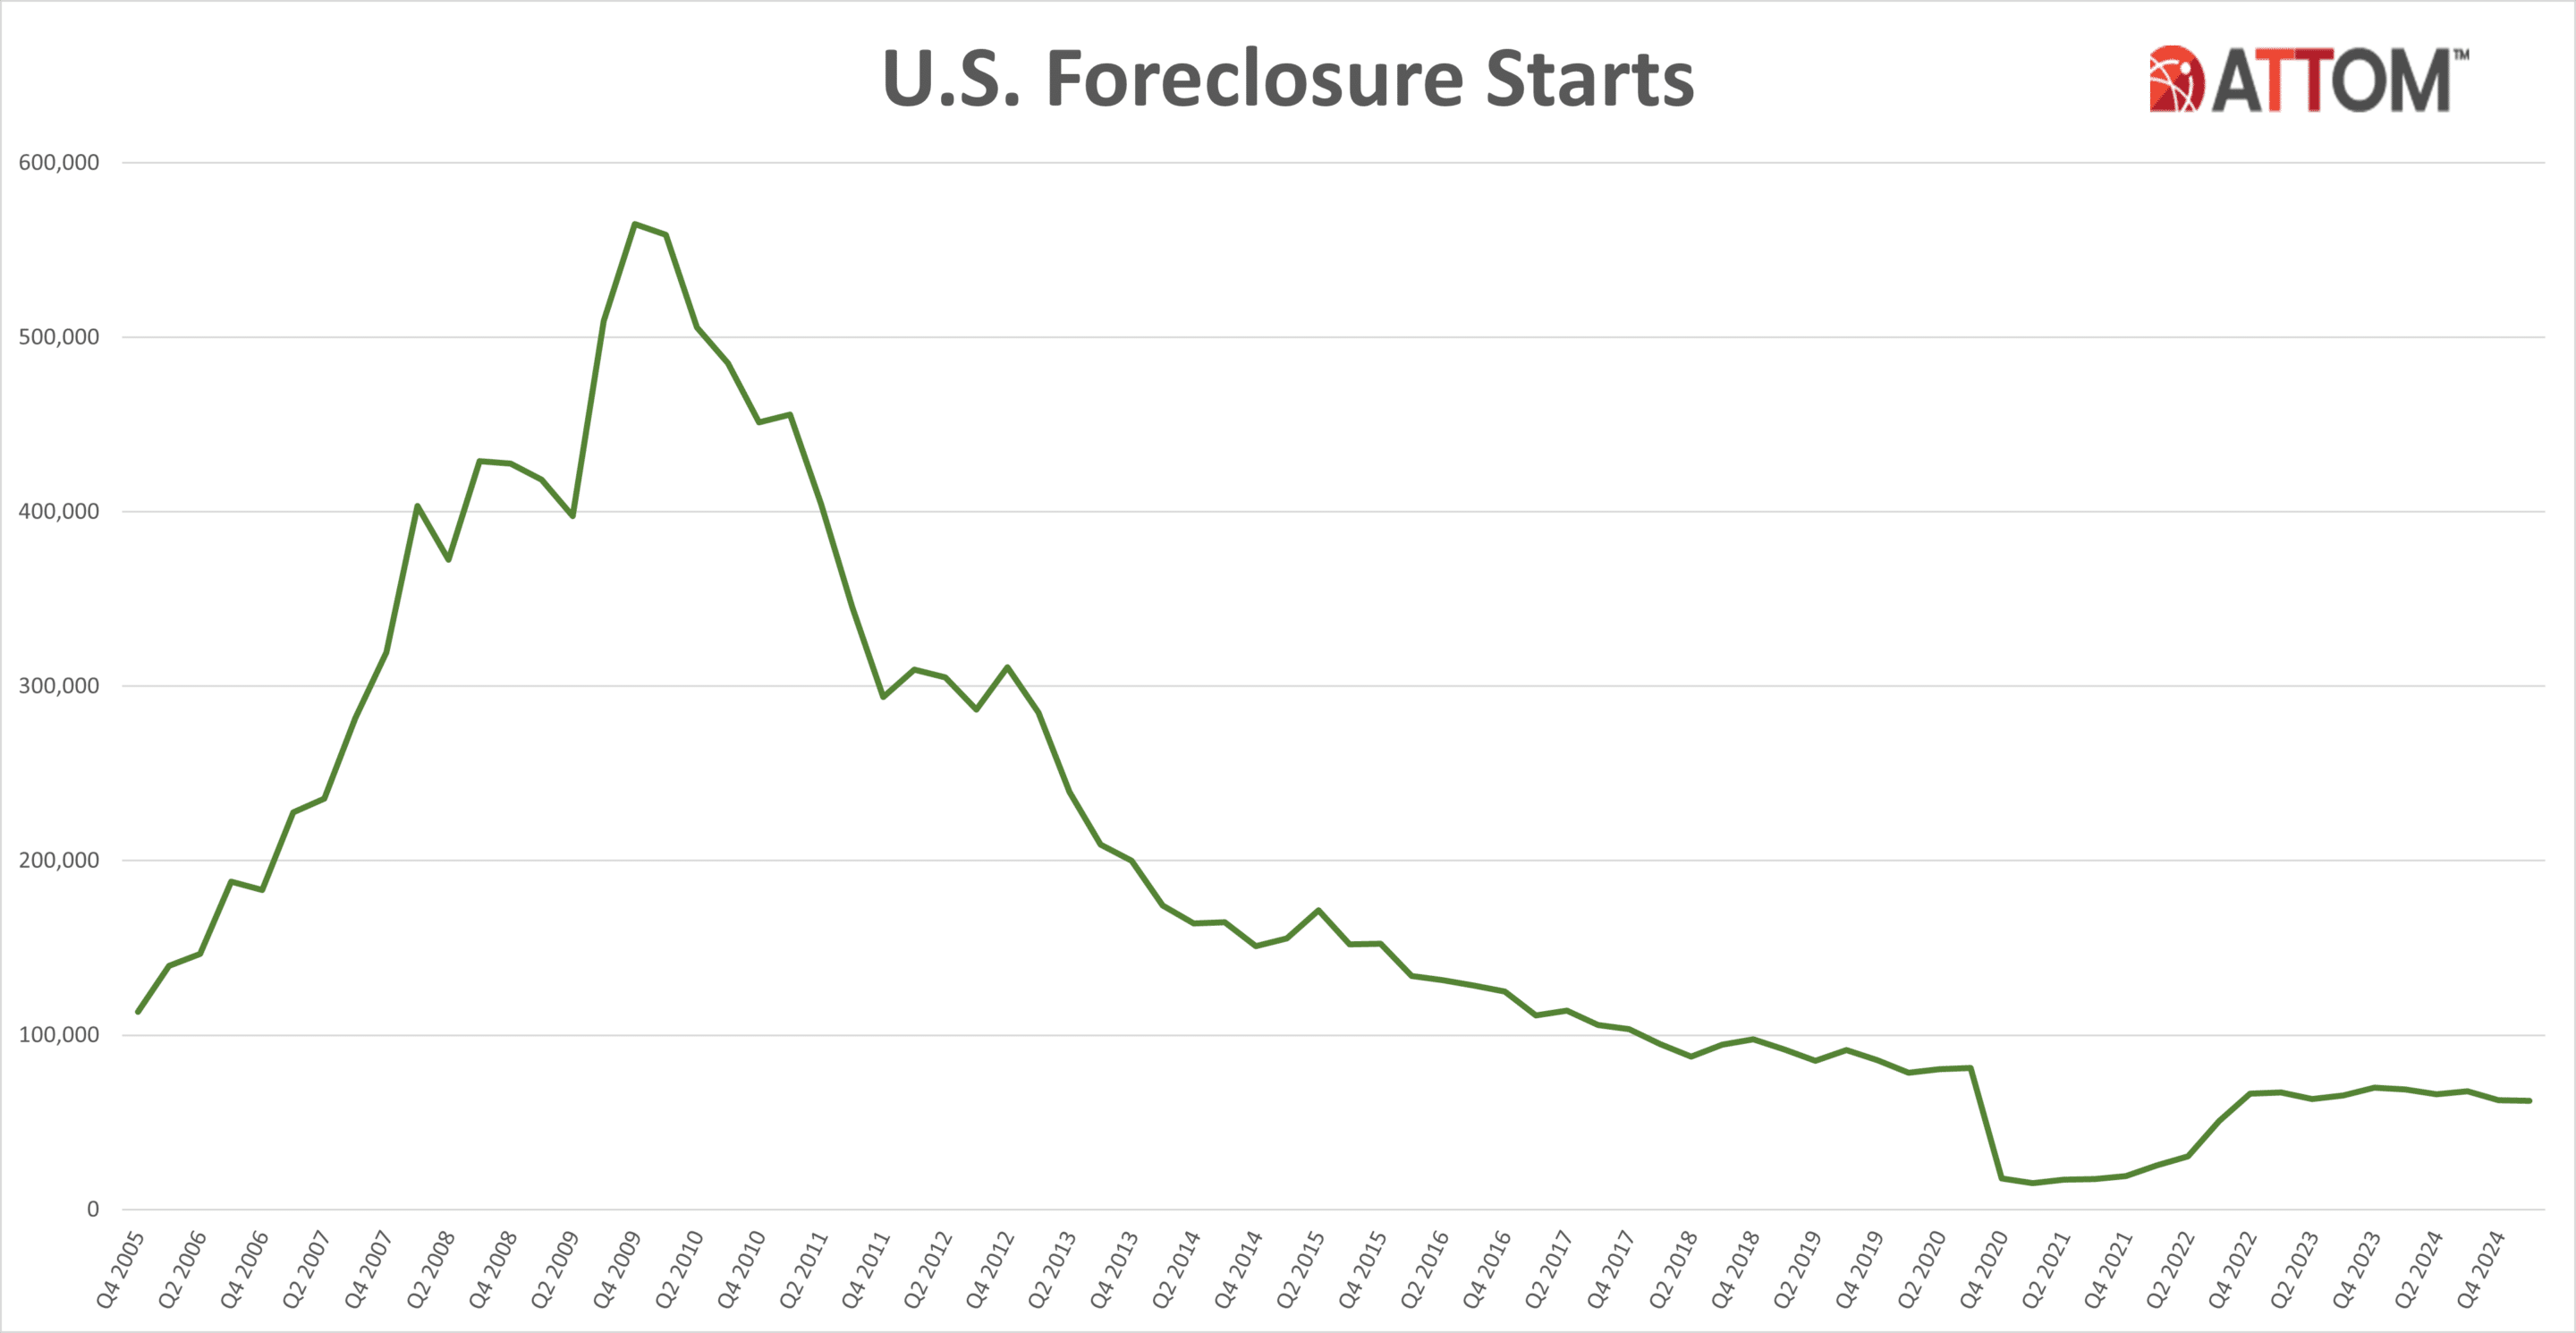
Those major metros with a population of 200,000 or more that had the greatest number of foreclosures starts in Q1 2025 included Chicago, IL (3,789 foreclosure starts); New York, NY (3,566 foreclosure starts); Houston, TX (3,046 foreclosure starts); Miami, FL (2,028 foreclosure starts); and Philadelphia, PA (1,985 foreclosure starts).
Highest foreclosure rates in Delaware, Illinois, and Nevada
Nationwide one in every 1,515 housing units had a foreclosure filing in Q1 2025. States with the highest foreclosure rates were Delaware (one in every 761 housing units with a foreclosure filing); Illinois (one in every 857 housing units); Nevada (one in every 874 housing units); Indiana (one in every 976 housing units); and South Carolina (one in every 1,021 housing units).
Among 225 metropolitan statistical areas with a population of at least 200,000, those with the highest foreclosure rates in Q1 2025 were Columbia, South Carolina (one in every 683 housing units); Lakeland, Florida (one in 694); Bakersfield, California (one in 718); Riverside, California (one in 721); and Chico, California (one in 724).
Other major metros with a population of at least 1 million, including Riverside at No. 4, and foreclosure rates in the top 15 highest nationwide, included Chicago, Illinois at No.6; Las Vegas, Nevada at No.7; Philadelphia, Pennsylvania at No. 13; and Indianapolis, Indiana at No. 14.
Bank repossessions increase 8 percent from last quarter
Lenders repossessed 9,691 U.S. properties through foreclosure (REO) in Q1 2025, up 8 percent from the previous quarter but down 4 percent from a year ago.
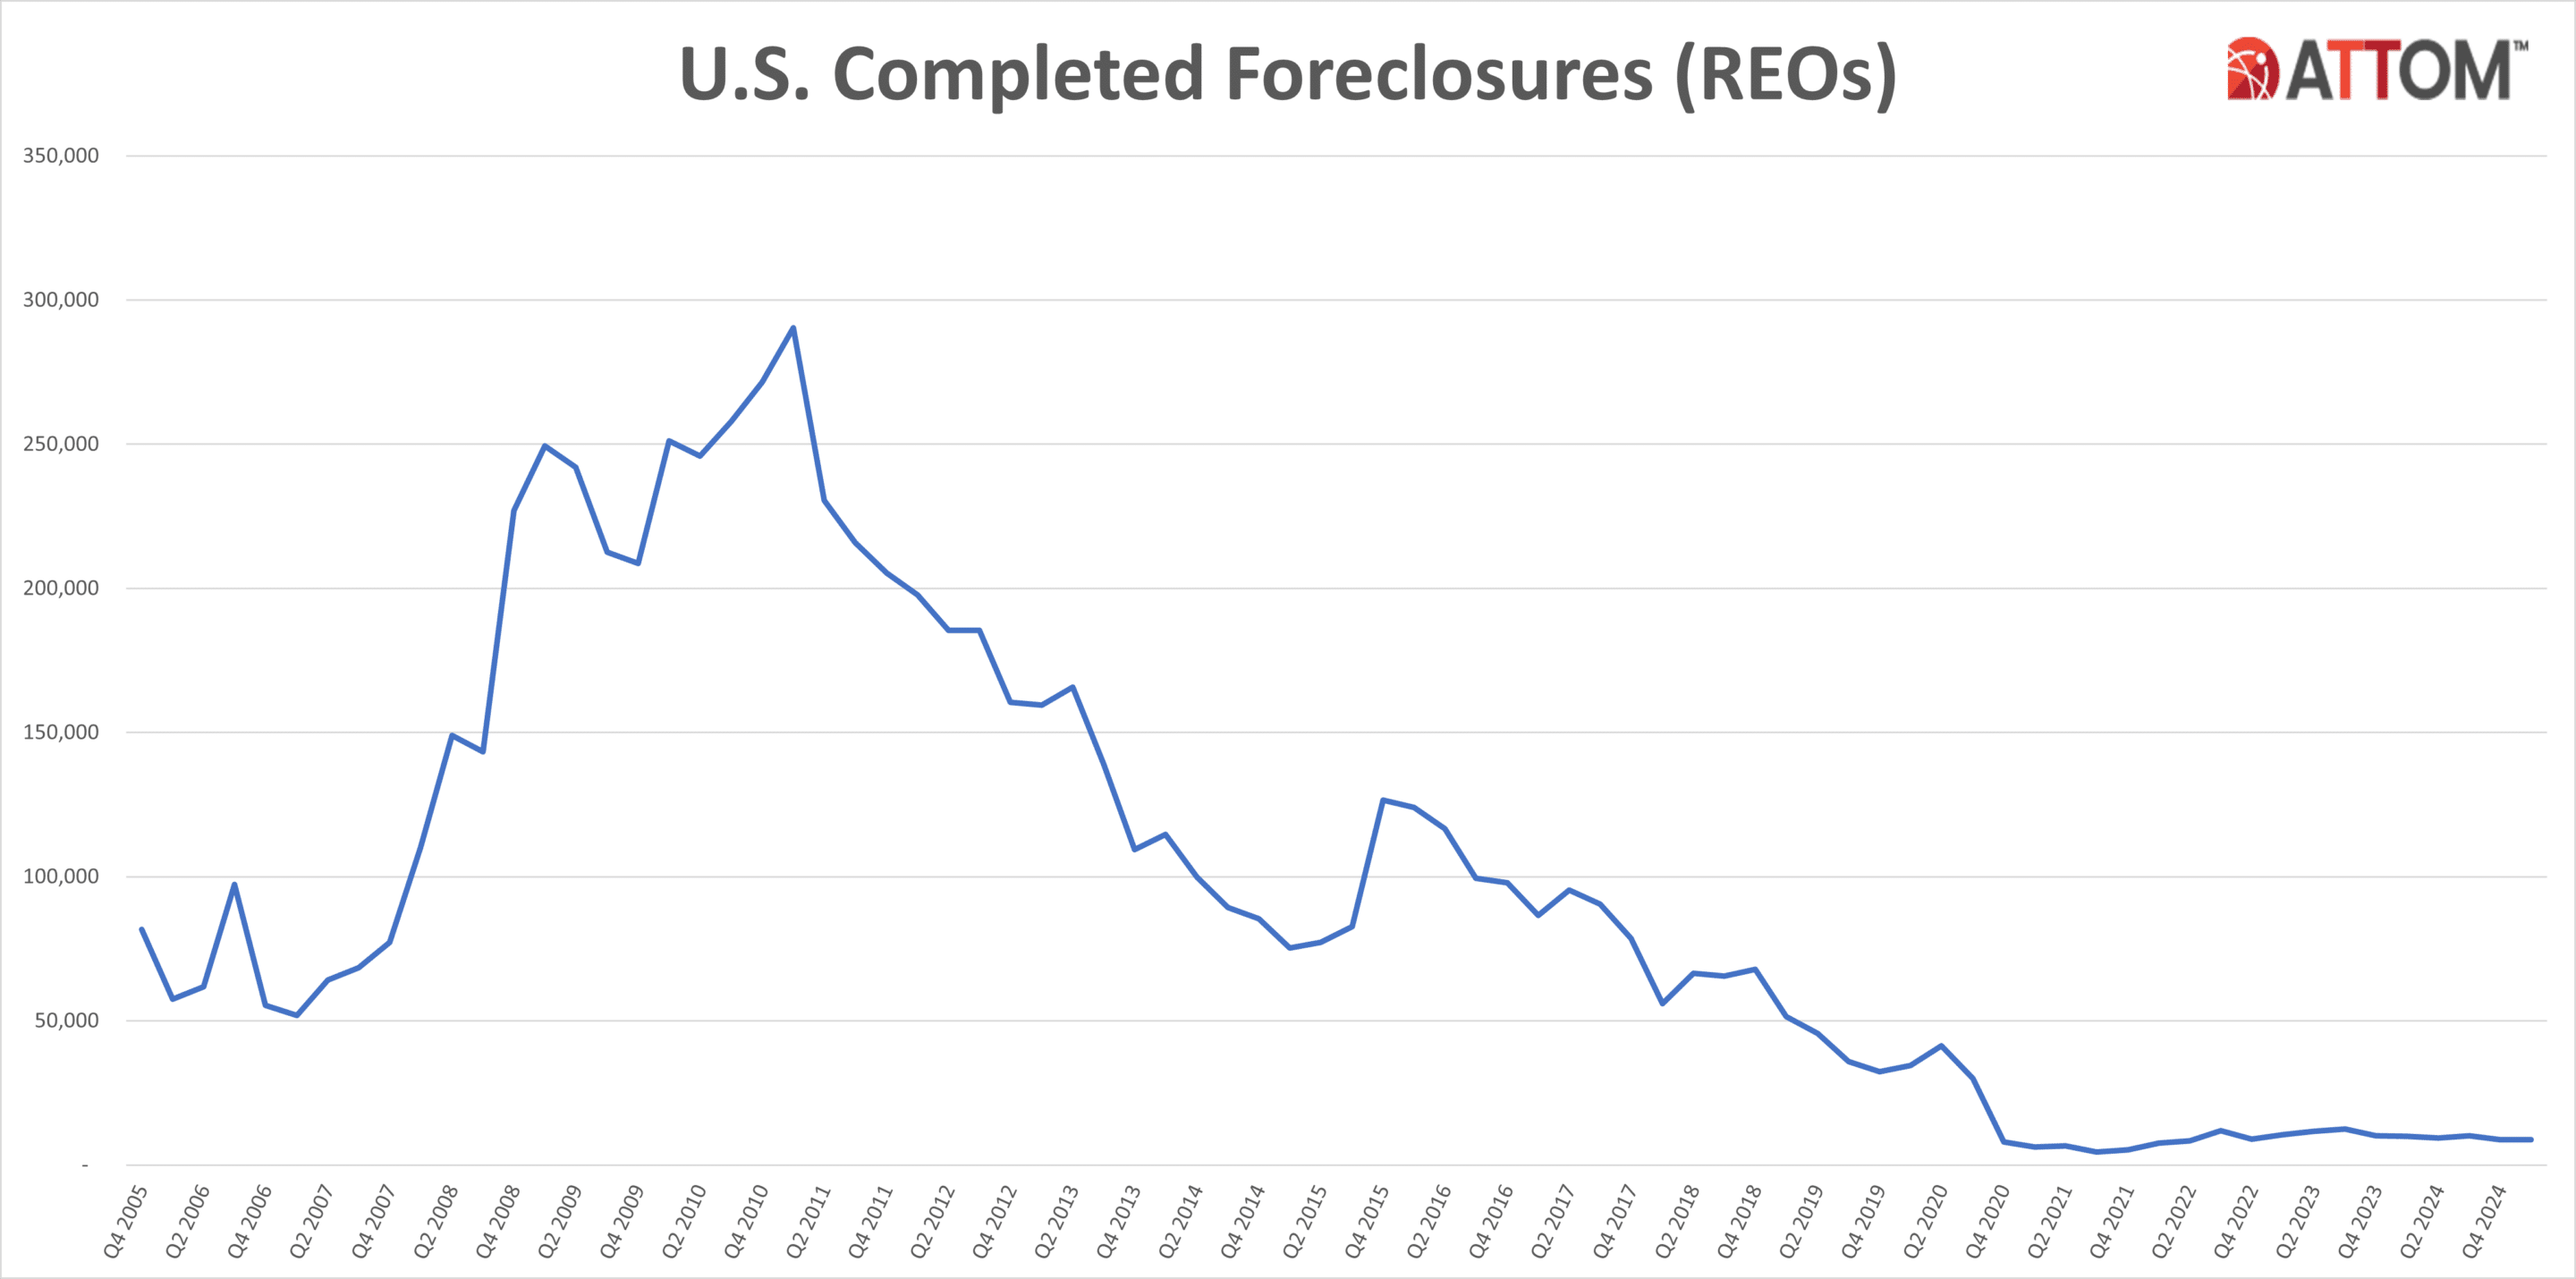
Those states that had the greatest number of REOs in Q1 2025 were California (944 REOs); Texas (938 REOs); Illinois (712 REOs); Pennsylvania (711 REOs); and Michigan (665 REOs).
Average time to foreclose decreases 12 percent from previous quarter
Properties foreclosed in Q1 2025 had been in the foreclosure process for an average of 671 days. This represents a 12 percent decrease from the previous quarter and a 9 percent decrease from the same time last year, continuing a downward trajectory observed since mid-2020.
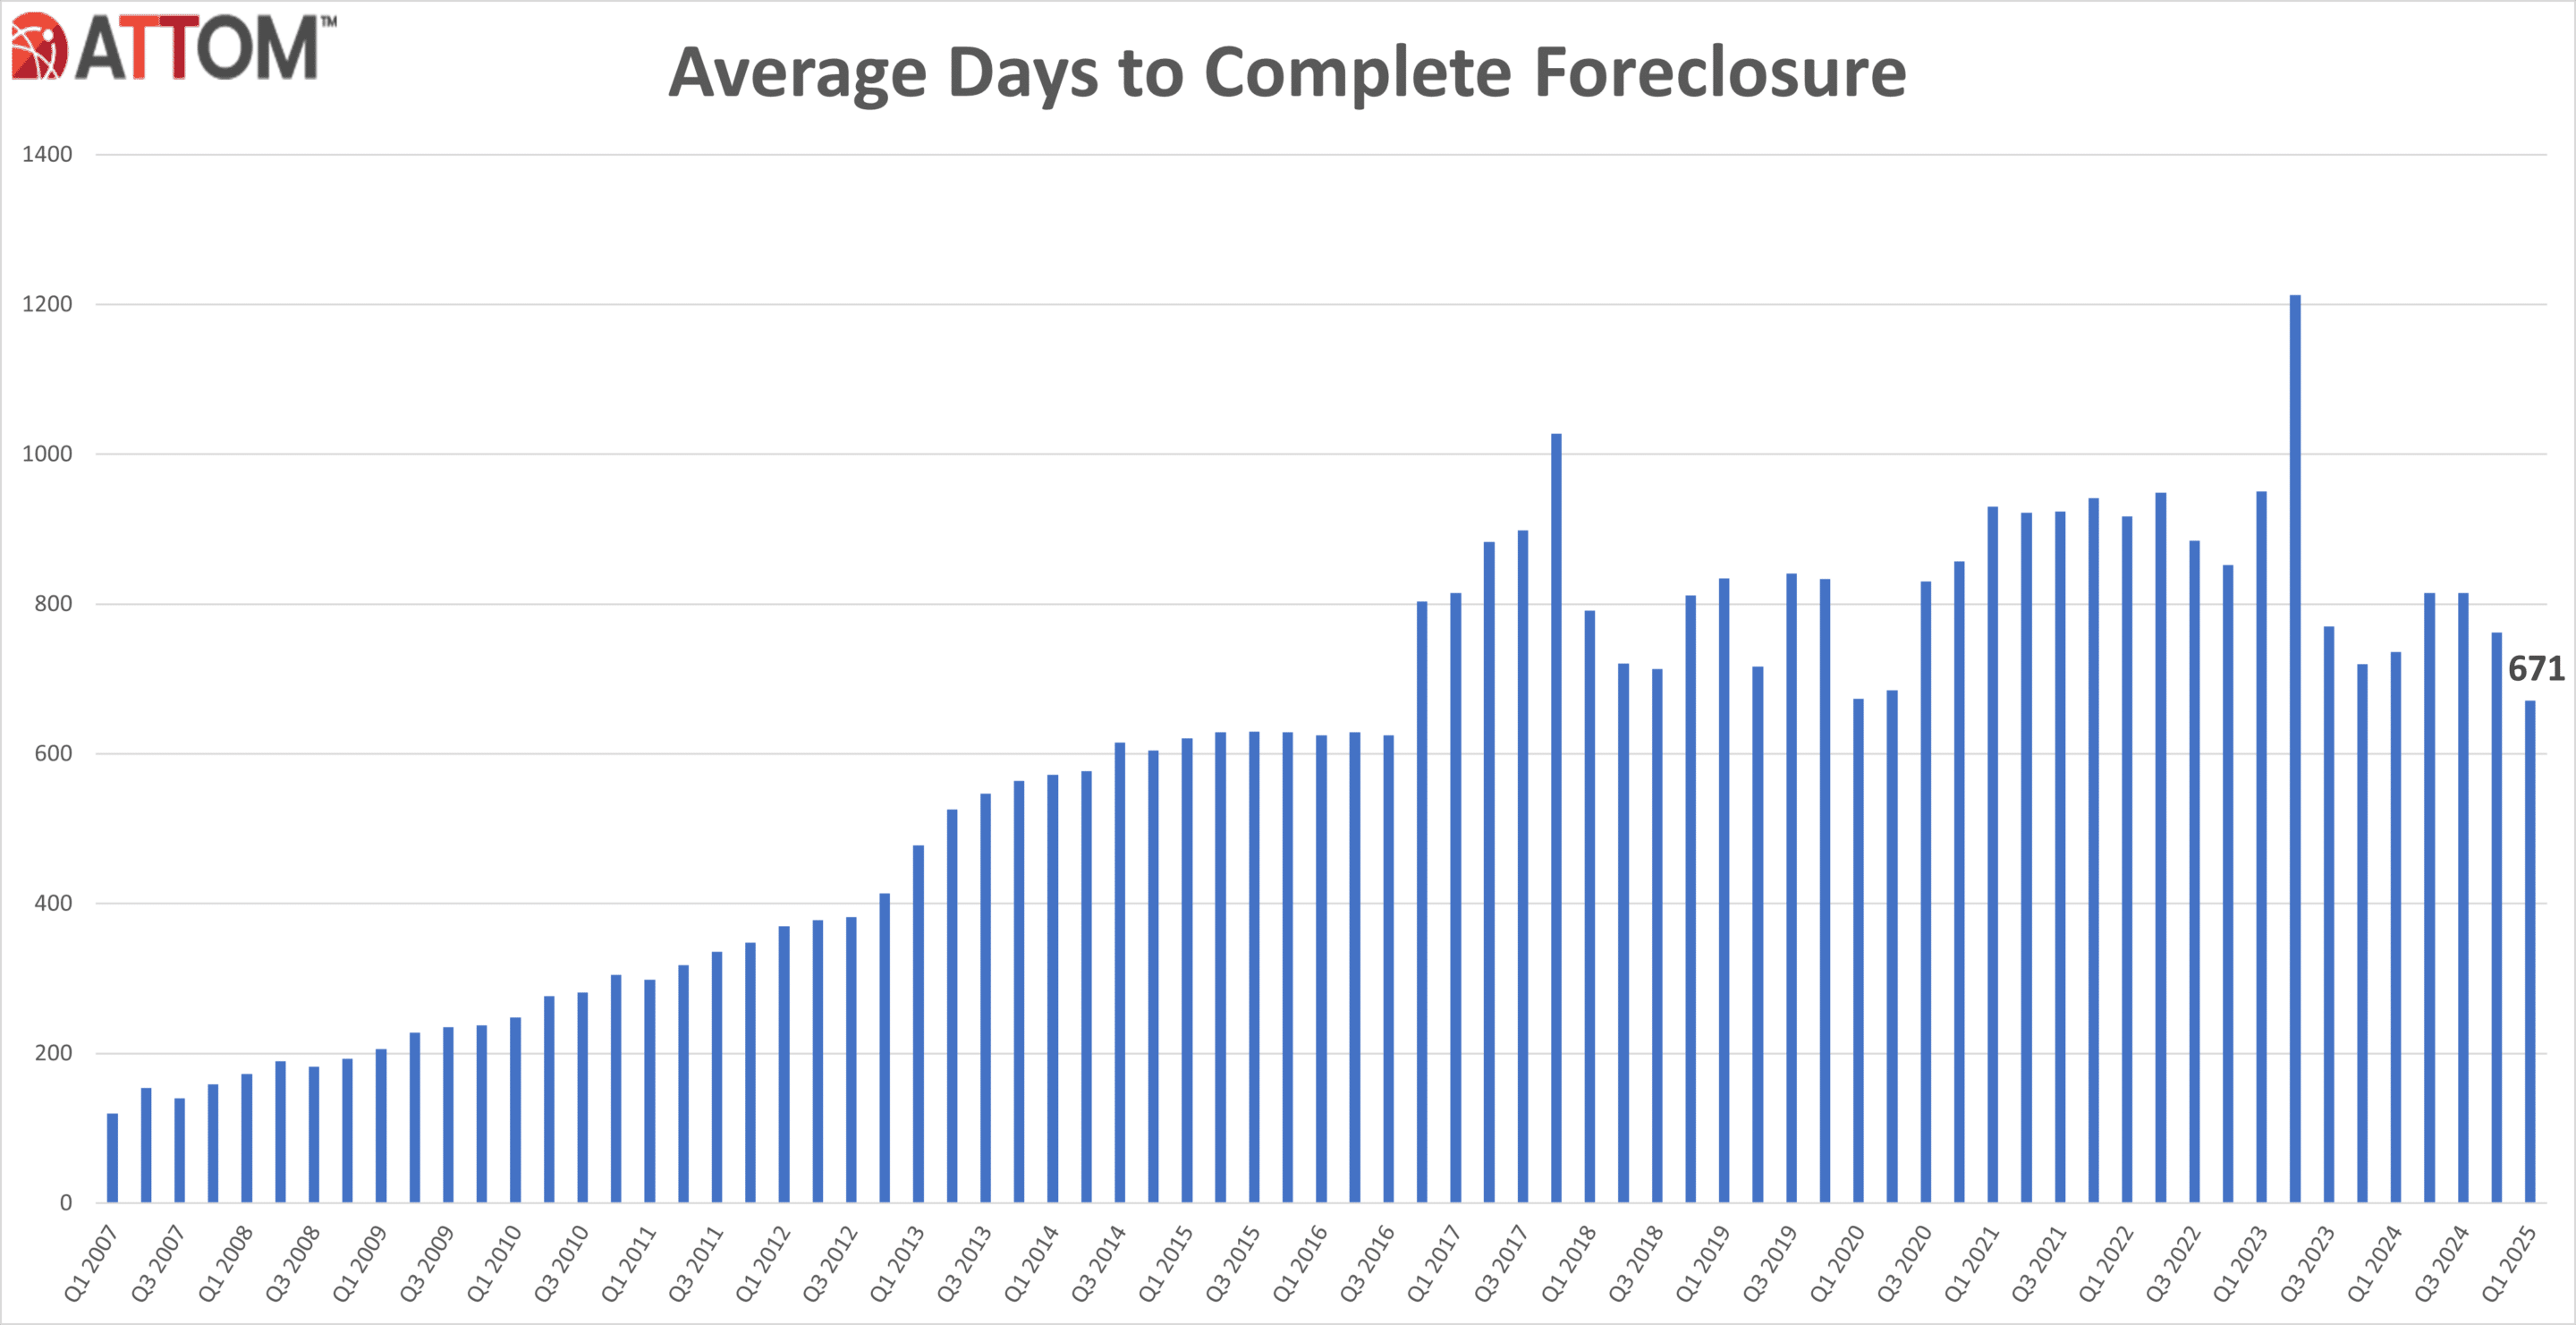
States with the longest average foreclosure timelines for homes foreclosed in Q1 2025 were Louisiana (3,038 days); Hawaii (2,274 days); Kentucky (1,993 days); Wisconsin (1,952 days); and New York (1,910 days).
States with the shortest average foreclosure timelines for homes foreclosed in Q1 2025 were New Hampshire (110 days); Texas (116 days); Wyoming (136 days); Minnesota (139 days); and Rhode Island (149 days).
March 2025 Foreclosure Activity High-Level Takeaways
- Nationwide in March 2025, one in every 3,965 properties had a foreclosure filing.
- States with the highest foreclosure rates in March 2025 were Delaware (one in every 2,256 housing units with a foreclosure filing); Nevada (one in every 2,274 housing units); Illinois (one in every 2,484 housing units); Indiana (one in every 2,505 housing units); and Connecticut (one in every 2,616 housing units).
- 25,070 U.S. properties started the foreclosure process in March 2025, up 10 percent from the previous month and up 8 percent from March 2024.
- Lenders completed the foreclosure process on 3,687 U.S. properties in March 2025, up 22 percent from the previous month and up 37 percent from March 2024.
U.S. Foreclosure Market Data by State – Q1 2025
| Rate Rank | State Name | Total Properties with Filings | 1/every X HU (Foreclosure Rate) | %∆ Q4 2024 | %∆ Q1 2024 |
| U.S. Total | 93,953 | 1,515 | 11.37 | -1.46 | |
| 19 | Alabama | 1,439 | 1,610 | 24.59 | -1.98 |
| 35 | Alaska | 119 | 2,680 | 77.61 | 13.33 |
| 15 | Arizona | 2,142 | 1,467 | 25.48 | 32.63 |
| 31 | Arkansas | 573 | 2,413 | -9.05 | -6.98 |
| 14 | California | 10,701 | 1,358 | -3.29 | -5.33 |
| 26 | Colorado | 1,202 | 2,117 | 38.00 | 30.09 |
| 9 | Connecticut | 1,295 | 1,182 | 3.35 | -16.34 |
| 1 | Delaware | 602 | 761 | 89.91 | 19.21 |
| District of Columbia | 282 | 1,263 | -12.96 | -25.20 | |
| 7 | Florida | 9,524 | 1,059 | 6.64 | -6.54 |
| 22 | Georgia | 2,558 | 1,753 | 23.87 | -5.92 |
| 39 | Hawaii | 188 | 3,005 | 8.67 | -10.90 |
| 36 | Idaho | 288 | 2,697 | 0.70 | -9.15 |
| 2 | Illinois | 6,355 | 857 | 48.69 | 15.76 |
| 4 | Indiana | 3,025 | 976 | 17.70 | 7.54 |
| 13 | Iowa | 1,057 | 1,350 | 14.77 | 12.09 |
| 47 | Kansas | 275 | 4,674 | -9.84 | 16.53 |
| 27 | Kentucky | 936 | 2,148 | 18.33 | 6.73 |
| 18 | Louisiana | 1,309 | 1,600 | 30.51 | 20.76 |
| 25 | Maine | 363 | 2,057 | -2.68 | 9.34 |
| 12 | Maryland | 1,899 | 1,340 | -0.31 | -24.25 |
| 29 | Massachusetts | 1,370 | 2,200 | -8.79 | -30.10 |
| 17 | Michigan | 2,907 | 1,582 | -1.59 | -8.90 |
| 30 | Minnesota | 1,061 | 2,375 | -1.67 | -7.74 |
| 46 | Mississippi | 298 | 4,473 | 3.11 | -30.86 |
| 37 | Missouri | 1,035 | 2,714 | -0.58 | 10.58 |
| 49 | Montana | 62 | 8,435 | 19.23 | -13.89 |
| 40 | Nebraska | 270 | 3,169 | 27.96 | 11.11 |
| 3 | Nevada | 1,496 | 874 | 16.51 | 11.64 |
| 42 | New Hampshire | 193 | 3,338 | 0.00 | -17.87 |
| 6 | New Jersey | 3,653 | 1,034 | 9.60 | -10.62 |
| 24 | New Mexico | 472 | 2,012 | 11.58 | 32.58 |
| 21 | New York | 4,952 | 1,724 | -1.14 | -18.69 |
| 23 | North Carolina | 2,658 | 1,812 | 26.15 | 10.61 |
| 45 | North Dakota | 91 | 4,119 | -18.75 | -2.15 |
| 11 | Ohio | 4,135 | 1,275 | 1.65 | -18.25 |
| 16 | Oklahoma | 1,137 | 1,551 | 26.19 | 28.62 |
| 43 | Oregon | 501 | 3,670 | -7.22 | 1.42 |
| 20 | Pennsylvania | 3,539 | 1,633 | 10.80 | -4.87 |
| 33 | Rhode Island | 190 | 2,551 | 13.77 | 14.46 |
| 5 | South Carolina | 2,353 | 1,021 | 42.87 | -7.47 |
| 50 | South Dakota | 20 | 19,945 | -53.49 | -61.54 |
| 34 | Tennessee | 1,163 | 2,662 | 14.36 | -5.14 |
| 10 | Texas | 9,354 | 1,271 | 20.71 | 12.25 |
| 8 | Utah | 1,021 | 1,169 | 12.94 | 66.56 |
| 48 | Vermont | 45 | 7,490 | 9.76 | -19.64 |
| 32 | Virginia | 1,507 | 2,425 | 10.32 | 7.18 |
| 38 | Washington | 1,147 | 2,845 | 16.57 | 38.19 |
| 44 | West Virginia | 219 | 3,925 | 16.49 | 8.42 |
| 41 | Wisconsin | 845 | 3,255 | -4.30 | -4.95 |
| 28 | Wyoming | 127 | 2,166 | 35.11 | 16.51 |
Report methodology
The ATTOM U.S. Foreclosure Market Report provides a count of the total number of properties with at least one foreclosure filing entered into the ATTOM Data Warehouse during the month and quarter. Some foreclosure filings entered into the database during the quarter may have been recorded in the previous quarter. Data is collected from more than 3,000 counties nationwide, and those counties account for more than 99 percent of the U.S. population. ATTOM’s report incorporates documents filed in all three phases of foreclosure: Default — Notice of Default (NOD) and Lis Pendens (LIS); Auction — Notice of Trustee Sale and Notice of Foreclosure Sale (NTS and NFS); and Real Estate Owned, or REO properties (that have been foreclosed on and repurchased by a bank). For the annual, midyear and quarterly reports, if more than one type of foreclosure document is received for a property during the timeframe, only the most recent filing is counted in the report. The annual, midyear, quarterly and monthly reports all check if the same type of document was filed against a property previously. If so, and if that previous filing occurred within the estimated foreclosure timeframe for the state where the property is located, the report does not count the property in the current year, quarter or month.
About ATTOM
ATTOM provides premium property data and analytics that power a myriad of solutions that improve transparency, innovation, digitization and efficiency in a data-driven economy. ATTOM multi-sources property tax, deed, mortgage, foreclosure, environmental risk, natural hazard, and neighborhood data for more than 155 million U.S. residential and commercial properties covering 99 percent of the nation’s population. A rigorous data management process involving more than 20 steps validates, standardizes, and enhances the real estate data collected by ATTOM, assigning each property record with a persistent, unique ID — the ATTOM ID. The 30TB ATTOM Data Warehouse fuels innovation in many industries including mortgage, real estate, insurance, marketing, government and more through flexible data delivery solutions that include ATTOM Cloud, bulk file licenses, property data APIs, real estate market trends, property navigator and more. Also, introducing our newest innovative solution, making property data more readily accessible and optimized for AI applications – AI-Ready Solutions.
Media Contact:
Megan Hunt
megan.hunt@attomdata.com
Data and Report Licensing:
datareports@attomdata.com
Written by: ATTOM Team