
Many prospective homebuyers are sidelined by near-record costs and economic uncertainty, creating a buyer’s market in many parts of the country. That’s deterring some would-be sellers.
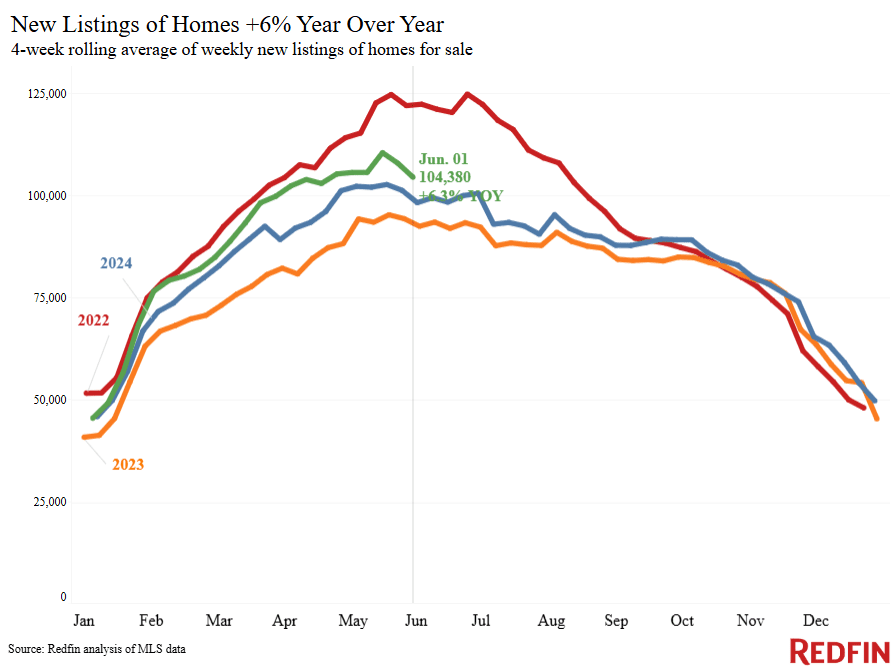
New listings of U.S. homes for sale rose 6.3% year over year during the four weeks ending June 1, one of the smallest increases of the last three months. New listings declined year over year in 11 of the 50 most populous U.S. metros, with the biggest drops in San Jose, CA and four Florida metros: Orlando, Fort Lauderdale, Tampa and West Palm Beach.
Zooming in on recent weeks, new listings fell during the second half of May. While it’s typical for listings to decline after peaking in mid-May, this year’s drop was the biggest for that time period in a decade.
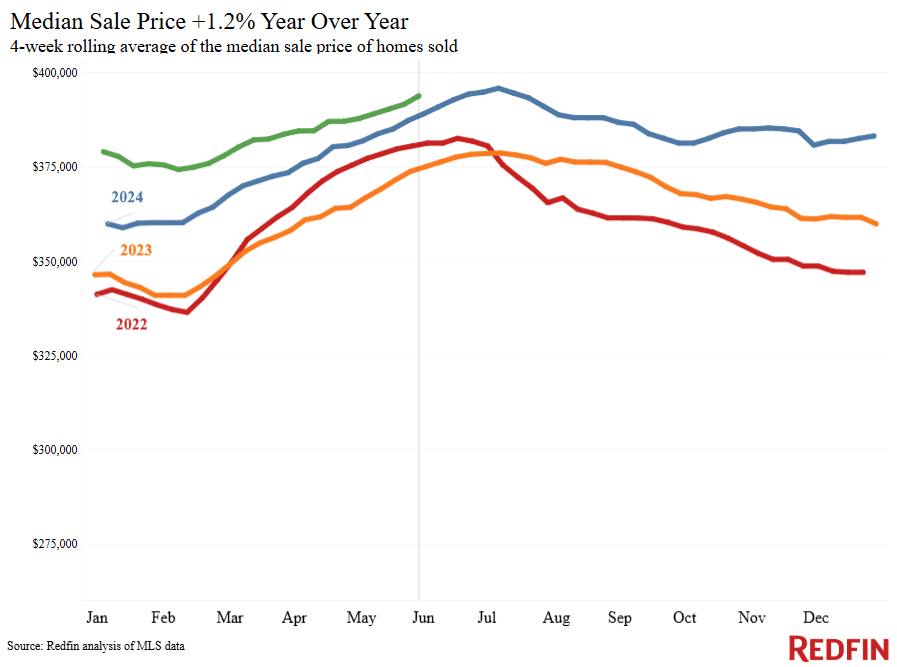
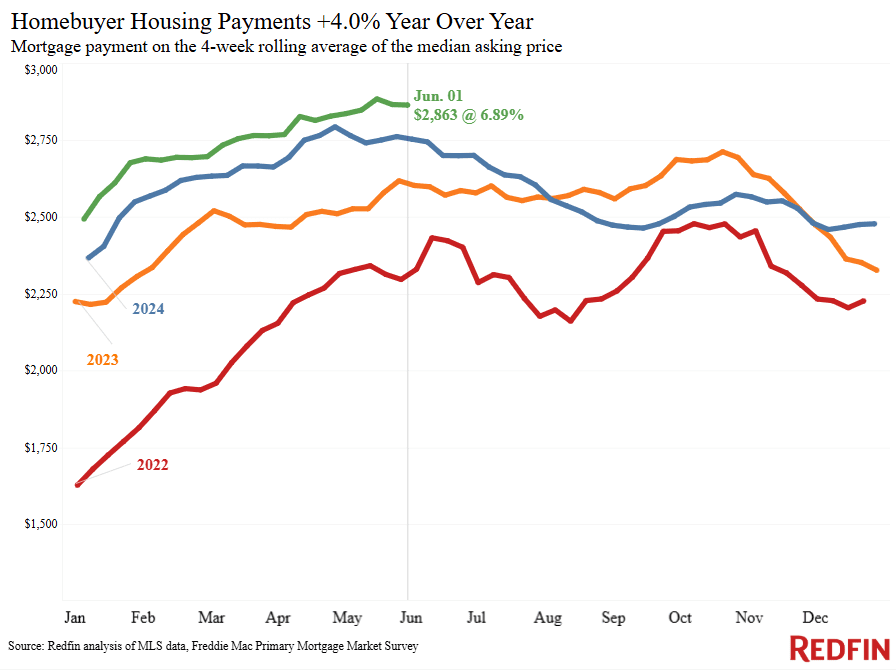
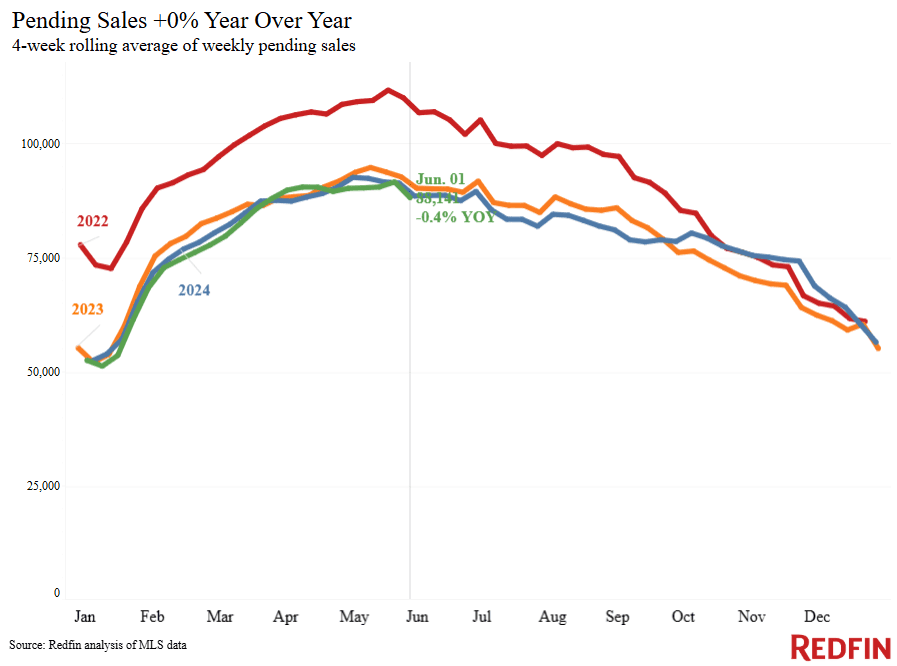
On the buying side, pending home sales declined 0.4% year over year to their lowest May level since 2020, and mortgage-purchase applications fell 3% week over week. Prospective buyers are backing off because housing costs are near record highs, with the median home-sale price up 1.2% year over year and the weekly average mortgage rate approaching 7%, and because the U.S. economy is unpredictable.
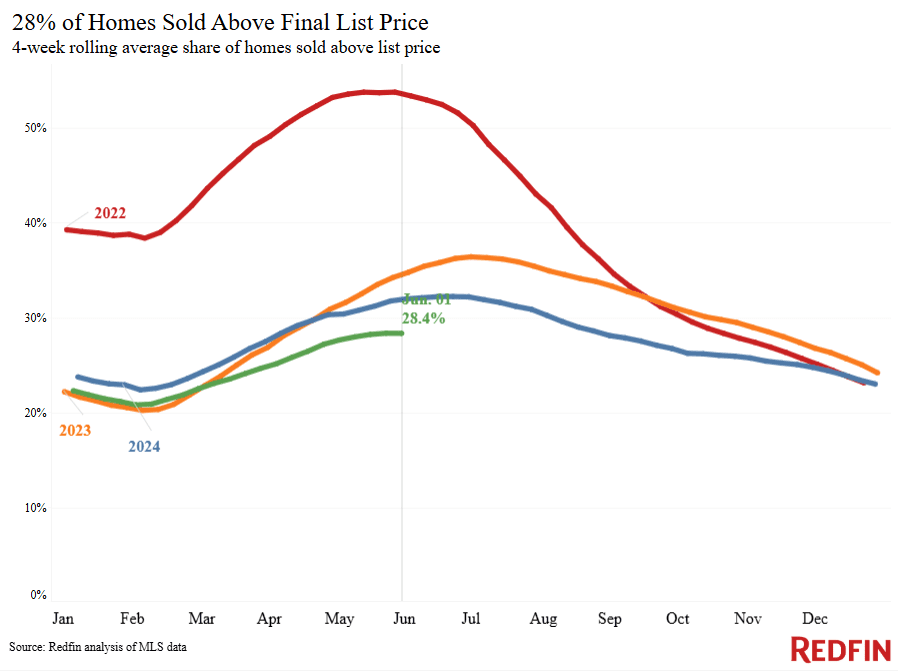
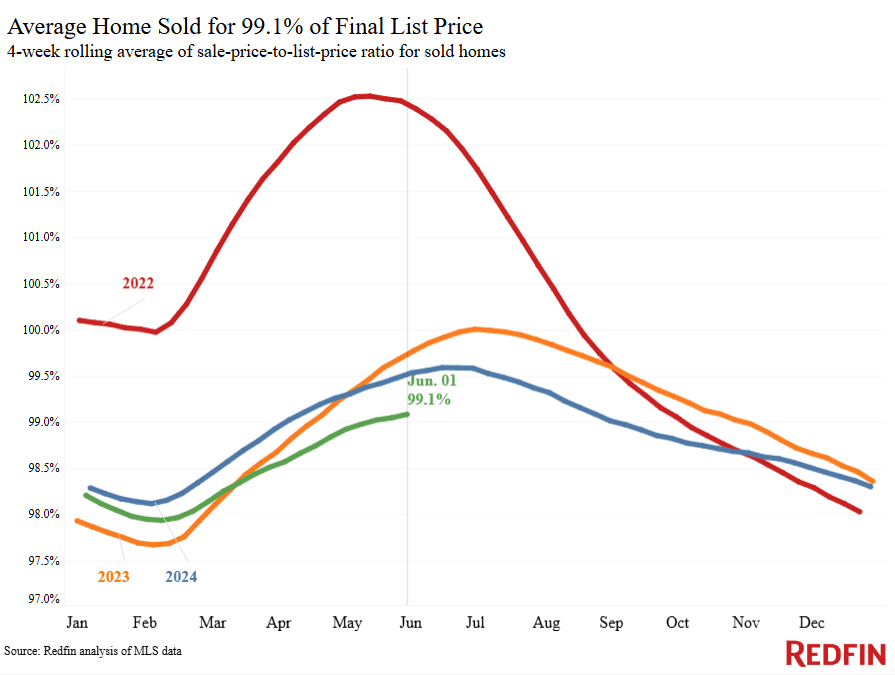
While there are hundreds of thousands more home sellers than buyers in the market–and new listings are still rising–the recent decline in listings suggests some of this spring’s would-be sellers are backing off. The typical home now sells for about 1% less than its asking price, the biggest discount for this time of year since 2020, and just about 28% of homes sell for above their asking price, down from 32% at this time last year.
“If a home is in a desirable neighborhood, especially if it’s fixed up, it will sell fairly quickly,” said Ben Ambroch, a Redfin Premier agent in Milwaukee. “But even that type of home now gets two or three offers, as opposed to the 10 offers it would have gotten a few years ago. Sellers of homes that need work in fringe neighborhoods should be able to find a buyer, but it’s important they come to the table with realistic expectations on price and timing, and a willingness to negotiate. Price within a fair range based on the neighborhood, understand that buyers will be inspecting the home, and be prepared to give concessions.”
For Redfin economists’ takes on the housing market, please visit Redfin’s “From Our Economists” page.
Leading indicators
| Indicators of homebuying demand and activity | ||||
| Value (if applicable) | Recent change | Year-over-year change | Source | |
| Daily average 30-year fixed mortgage rate | 6.87% (June 4) | Down from 6.97% one week earlier | Down from 7.17% | Mortgage News Daily |
| Weekly average 30-year fixed mortgage rate | 6.89% (week ending May 29) | Highest level since Feb. | Down from 7.03% | Freddie Mac |
| Mortgage-purchase applications (seasonally adjusted) | Down 4% from a week earlier (as of week ending May 30) | Up 18% | Mortgage Bankers Association | |
| Redfin Homebuyer Demand Index | Down 3% from a month earlier (as of week ending June 1) | Up 1% | A measure of tours and other homebuying services from Redfin agents | |
| Google searches for “home for sale” | Up 20% from a month earlier (as of June 1) | Up 20% | Google Trends | |
| We excluded ShowingTime stats this week to ensure data accuracy. | ||||
Key housing-market data
| U.S. highlights: Four weeks ending June 1, 2025
Redfin’s national metrics include data from 400+ U.S. metro areas, and are based on homes listed and/or sold during the period. Weekly housing-market data goes back through 2015. Subject to revision. |
|||
| Four weeks ending June 1, 2025 | Year-over-year change | Notes | |
| Median sale price | $393,750 | 1.2% | |
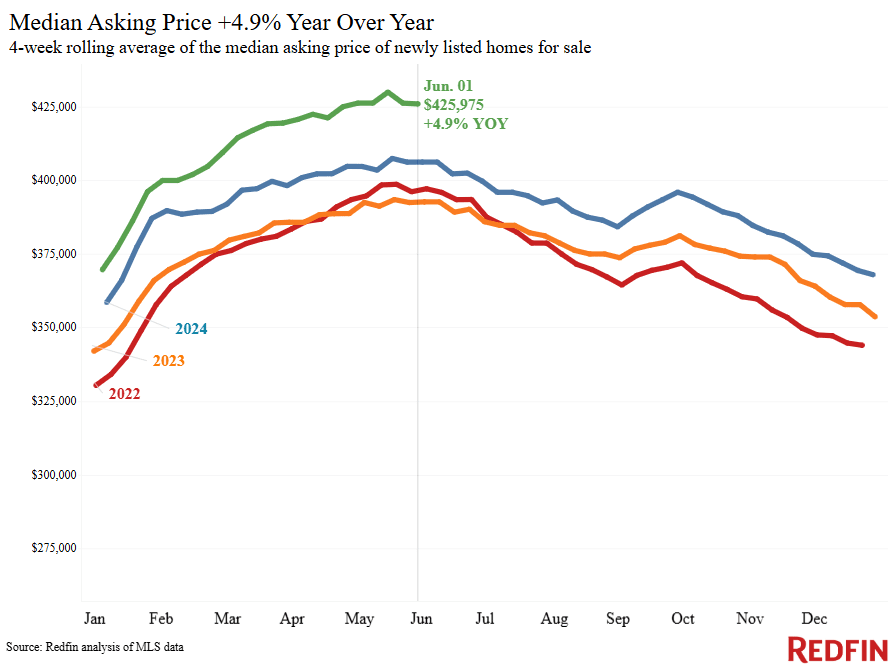
| Median asking price | $425,975 | 4.9% | |
| Median monthly mortgage payment | $2,863 at a 6.89% mortgage rate | 4% | $20 shy of record high |
| Pending sales | 88,141 | -0.4% | |
| New listings | 104,380 | 6.3% | |
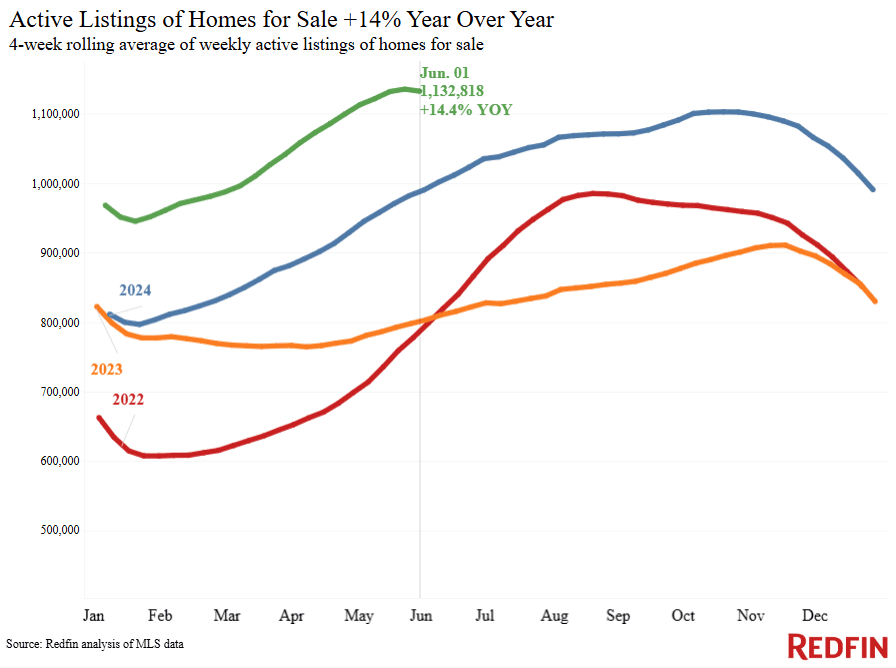
| Active listings | 1,132,818 | 14.4% | Smallest increase in over a year |
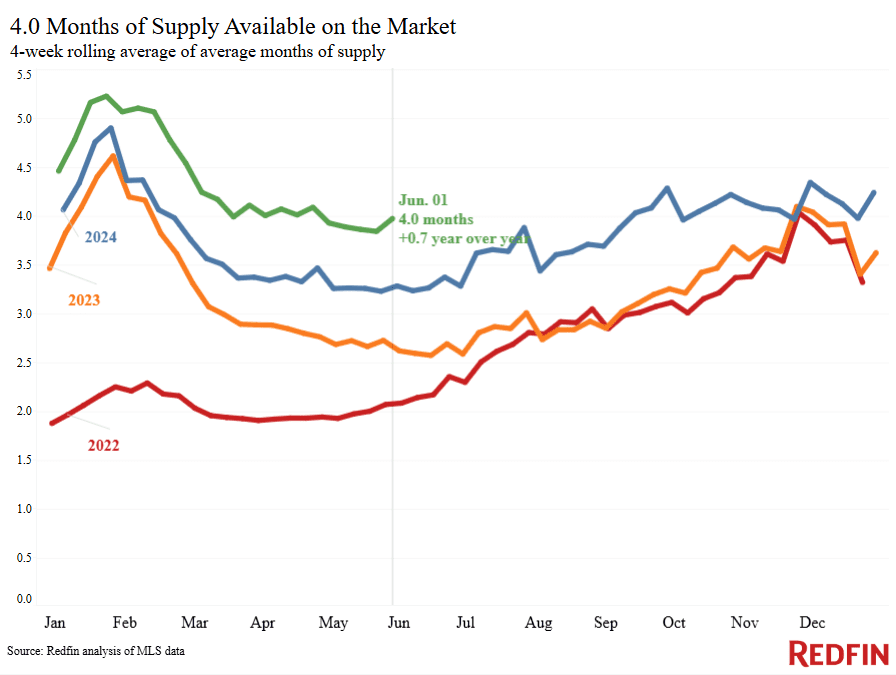
| Months of supply | 4 | +0.7 pts. | 4 to 5 months of supply is considered balanced, with a lower number indicating seller’s market conditions |
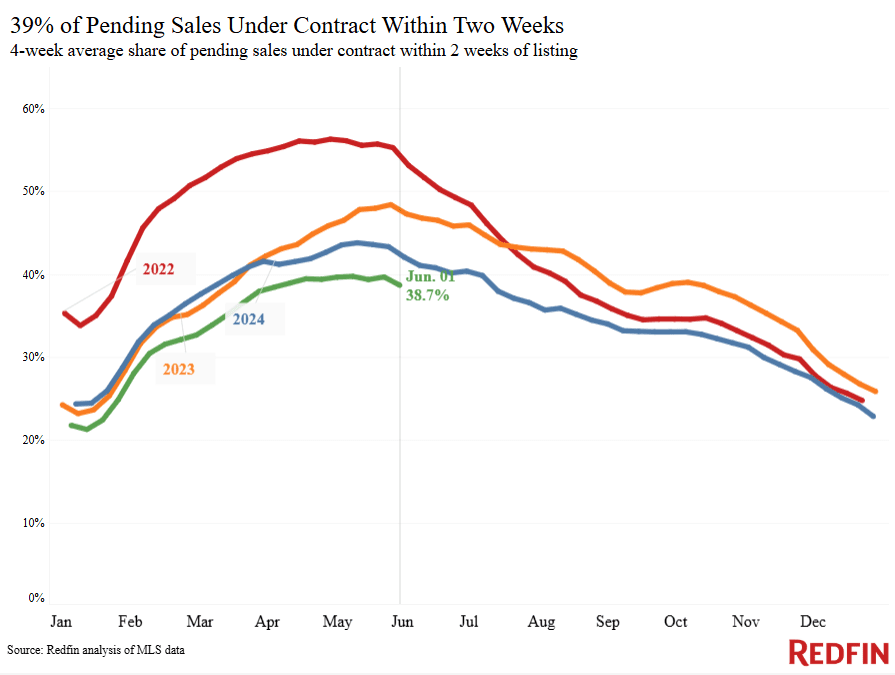
| Share of homes off market in two weeks | 38.7% | Down from 42% | |
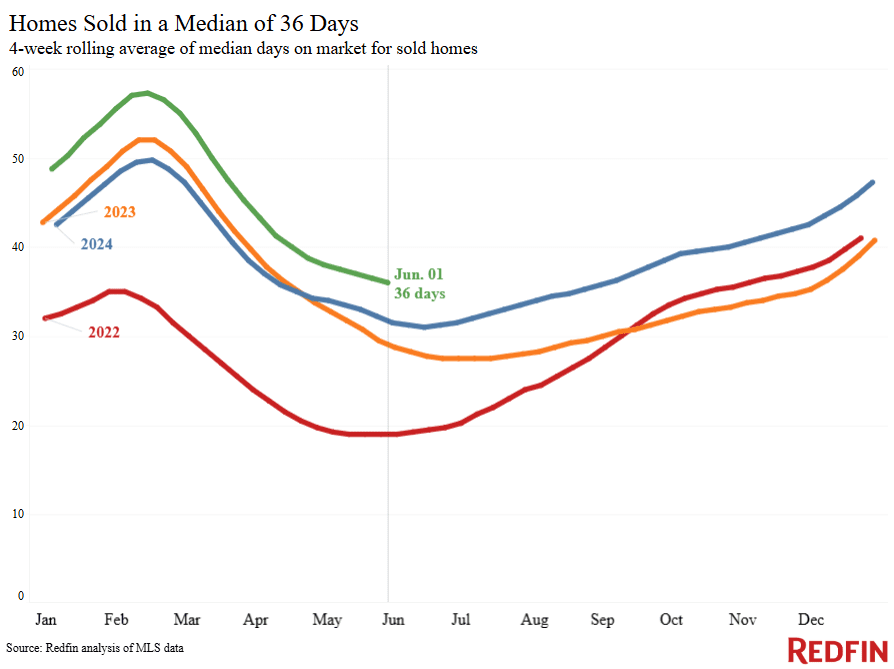
| Median days on market | 36 | +4 days | |
| Share of homes sold above list price | 28.4% | Down from 32% | |
| Average sale-to-list price ratio | 99.1% | Down from 99.5% | |
|
Metro-level highlights: Four weeks ending June 1, 2025 Redfin’s metro-level data includes the 50 most populous U.S. metros. Select metros may be excluded from time to time to ensure data accuracy. |
|||
|---|---|---|---|
| Metros with biggest year-over-year increases | Metros with biggest year-over-year decreases |
Notes |
|
| Median sale price | Philadelphia (11.4%)
Detroit (10.6%) Pittsburgh (7.4%) Miami (7.1%) New Brunswick, NJ (6.9%) |
Oakland, CA (-8.5%)
Dallas (-4.5%) Jacksonville, FL (-3.6%) Houston (-2.4%) Austin, TX (-1.6%) |
Declined in 9 metros |
| Pending sales | Cincinnati (10.9%)
Chicago (6.5%) Boston (5.7%) Montgomery County, PA (4.7%) Indianapolis (4.2%) |
Miami (-19.6%)
San Jose, CA (-16.2%) Fort Lauderdale, FL (-15.9%) Las Vegas (-15.4%) San Diego (-12.2%) |
|
| New listings | Houston (13.9%)
Washington, D.C. (13.5%) Montgomery County, PA (13.2%) Seattle (12%) Cincinnati (11.4%) |
San Jose, CA (-9%)
Orlando, FL (-8.3%) Fort Lauderdale, FL (-6.8%) Tampa, FL (-6.8%) West Palm Beach, FL (-5.5%) |
Declined in 11 metros |
Refer to our metrics definition page for explanations of all the metrics used in this report.

Written by: Dana Anderson