
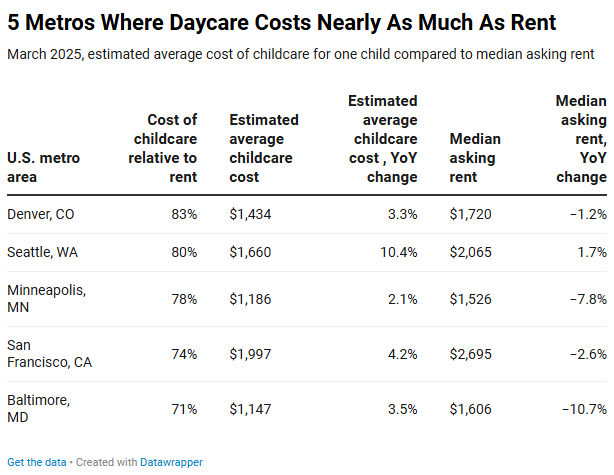
In Denver and Seattle, families pay nearly as much for daycare as they do for rent–and they pay much more for daycare than rent if it’s for two children.
The average monthly cost of sending one child to daycare in Denver is $1,434, equal to 83% of the typical rent payment ($1,720) in that metro area. Sending two kids to daycare in Denver costs $2,867, or 167% of the typical rent payment.
In Seattle, the average cost of sending one child to daycare is $1,660, equal to 80% of that metro area’s rent payment ($2,065). For two kids, that’s $2,320 for childcare, or 160% of rent.
Minneapolis comes next in terms of where childcare costs most relative to rent. The typical daycare cost in Minneapolis is $1,186, equal to 78% of the area’s typical rent cost of $1,526 (155% for two kids). Rounding out the top five are San Francisco (childcare: $1,997, 74% of rent for 1 kid; 148% for 2 kids) and Baltimore ($1,147, 71% of rent for 1 kid; 142% for two kids).
For this analysis, we used childcare cost data from the U.S. Department of Labor, and estimated March 2025 costs using inflation metrics. March 2025 rents are from Redfin’s median asking rent data for the three months ending March 31, 2025. Included in this analysis are the 20 U.S. metro areas for which we have sufficient childcare and inflation data. When we say “daycare” or “childcare,” we’re referring to many different types of childcare, including center-based care and home-based care. Please see the end of this report for more details on methodology.
In Denver, Seattle, and San Francisco, families pay nearly as much for childcare as they do for rent because while housing is expensive in those places, so is childcare. San Francisco has the most expensive childcare in the country, followed by Seattle, Boston and Denver.
It’s difficult for many American families to afford housing, especially as rents remain near record levels and the cost of buying a home is at an all-time high. Add the high cost of childcare, which is another non-negotiable cost for many families, and it becomes even more challenging to pay for basic needs.
Childcare costs are rising year over year in 17 or the 20 metro areas in this analysis, with the biggest increases in Seattle (10.4%), San Diego, CA (9.2%) and Boston (5%). Rents are rising in seven of the metros in this analysis–and they may start rising soon in many others.
“America has a housing affordability crisis–and it also has a childcare affordability crisis,” said Redfin Chief Economist Daryl Fairweather. “When the combination of housing and childcare costs take up such a huge chunk of household income, it strains budgets and puts a major burden on working families. It also exacerbates inequality, with many women deciding to leave the workforce or put career advancements on hold rather than paying for childcare. Other Americans are choosing not to have children because they can’t afford it. Expanding access to more affordable childcare would go a long way toward easing the burden on young families.”
Paying for both childcare and rent eats up a significant portion of household income in much of the country. Take Philadelphia, which falls roughly in the middle in terms of both childcare and rent costs, as an example: Sending one child to daycare plus paying rent eats up nearly half (46%) of the local median household income. In both Denver and Seattle, the combination of rent and childcare costs roughly one-third of median household income.
Sending Two Kids to Daycare Costs More Than Rent in 14 of the 20 Metros in This Analysis
Sending two kids to daycare costs more than rent in 14 of the 20 metros in this analysis. As noted above, the premium of childcare for two kids to rent is the biggest in the places where it’s biggest for one kid: Denver, Seattle, Minneapolis, San Francisco and Baltimore.
The cost of childcare for two kids also clocks in at more than rent in St. Louis, Washington, D.C., Phoenix, Chicago, Houston, Dallas, Boston, Philadelphia and Riverside, CA.
Using the Philadelphia example, sending two kids to daycare costs an average of $1,922, more than the typical rent payment of $1,885. The combined cost of rent and daycare for two kids in Philadelphia is equal to 61% of the local median income.
“When rent and childcare take up half of a family’s income, and you add the cost of other essentials like groceries and bills, there’s not much left for anything else,” Fairweather said. “That makes the decision to have children a huge financial sacrifice, where families are forced to live on the financial edge, without much disposable income or money to put into savings, until their kids are older.”
It’s worth noting that a major difference between rent and childcare costs is that the latter is typically temporary; kids can attend free public school starting in kindergarten (or earlier, in some parts of the country). Also, while we assumed the cost of sending two children to daycare is double the cost of sending one child, many childcare centers offer sibling discounts; the payment for the second child may be slightly less than that for the first.
The only places where sending two kids to daycare costs less than rent are Miami, Los Angeles, New York, Atlanta, Tampa, FL and San Diego.
For the last three, the difference is nominal; sending two kids to daycare in those metros costs roughly 97% of rent. In Miami, Los Angeles, and New York, it’s mainly because monthly rents are so high, with medians clocking in between $2,400 and $2,900.
Childcare Costs Are Low Compared to Rent in Miami, Los Angeles, and New York–But Paying For Both Still Eats Up Roughly Half the Median Income
In Miami, the average cost of daycare is equal to just 32% of the typical rent payment. Miami is the metro area where childcare costs least relative to rent, partly because the cost of childcare is relatively low and partly because rents are high.
Miami has the third-lowest average childcare cost of the metros in this analysis, clocking in at $764 per month (only Houston and Atlanta have lower averages), while it has the sixth-highest rent, at $2,415.
Los Angeles and New York come next in terms of where childcare costs least relative to rent. In the Los Angeles metro, it costs an average of $1,145 to send one child to daycare, which is equal to 42% of the local rent payment ($2,747). In New York, it costs $1,208, equal to 43% of rent ($2,843).
New York has the highest rent in the country, and Los Angeles has the third-highest rent (Boston comes in second). In fact, the high cost of rent in Miami, Los Angeles and New York pushes those metros to the top of the list in terms of how much money families are spending on the combination of rent and childcare. Paying for childcare for one child and rent eats up half of the local median household income in Miami, the highest share of all the metros in this analysis.
In both Los Angeles and New York, the combo of those costs eats up nearly half (48% and 49%, respectively) of the local median income, the next-highest shares.
| Metro Summary: Cost of childcare relative to cost of rent, March 2025
20 U.S. metros for which we have sufficient childcare and inflation data Estimated average childcare cost, median asking rent (for the 3 months ending March 31, 2025), median local household income |
||||||||
| U.S. metro area | Cost of childcare relative to rent | Estimated average childcare cost (one child) | Estimated average childcare cost (one child), YoY change | Median asking rent | Median asking rent, YoY change | Median household income | Median cost of childcare + rent | Share of monthly income spent on rent + childcare |
| Atlanta, GA | 48.1% | $739 | 1.8% | $1,535 | 0.4% | $8,047.75 | $2,274 | 28.3% |
| Baltimore, MD | 71.4% | $1,147 | 3.5% | $1,606 | -10.7% | $9,263.67 | $2,753 | 29.7% |
| Boston, MA | 57.7% | $1,609 | 5.0% | $2,787 | 6.9% | $10,430.92 | $4,396 | 42.1% |
| Chicago, IL | 59.3% | $1,037 | 4.0% | $1,750 | 5.2% | $8,159.08 | $2,787 | 34.2% |
| Dallas, TX | 58.5% | $851 | 3.0% | $1,455 | -5.4% | $8,417.00 | $2,306 | 27.4% |
| Denver, CO | 83.4% | $1,434 | 3.3% | $1,720 | -1.2% | $9,511.58 | $3,154 | 33.2% |
| Houston, TX | 58.8% | $735 | -0.2% | $1,249 | -1.6% | $7,513.83 | $1,984 | 26.4% |
| Los Angeles, CA | 41.7% | $1,145 | 3.2% | $2,747 | -2.3% | $8,042.42 | $3,892 | 48.4% |
| Miami, FL | 31.6% | $764 | 2.3% | $2,415 | -0.2% | $6,295.25 | $3,179 | 50.5% |
| Minneapolis, MN | 77.7% | $1,186 | 2.1% | $1,526 | -7.8% | $9,057.92 | $2,712 | 29.9% |
| New York, NY | 42.5% | $1,208 | 4.8% | $2,843 | -3.2% | $8,228.25 | $4,051 | 49.2% |
| Philadelphia, PA | 51.0% | $961 | 3.3% | $1,885 | 2.4% | $6,244.39 | $2,846 | 45.6% |
| Phoenix, AZ | 62.2% | $918 | -2.0% | $1,475 | -2.6% | $6,244.39 | $2,393 | 38.3% |
| Riverside, CA | 50.7% | $1,183 | 3.0% | $2,333 | 1.2% | $7,893.95 | $3,516 | 44.5% |
| San Diego, CA | 49.2% | $1,318 | 9.2% | $2,677 | -9.7% | $9,373.54 | $3,995 | 42.6% |
| San Francisco, CA | 74.1% | $1,997 | 4.2% | $2,695 | -2.6% | $13,590.71 | $4,692 | 34.5% |
| Seattle, WA | 80.4% | $1,660 | 10.4% | $2,065 | 1.7% | $10,843.98 | $3,725 | 34.3% |
| St. Louis, MO | 70.5% | $899 | -1.4% | $1,275 | -4.3% | $7,304.73 | $2,174 | 29.8% |
| Tampa, FL | 48.2% | $865 | 2.4% | $1,793 | -0.2% | $6,551.61 | $2,658 | 40.6% |
| Washington, DC | 68.0% | $1,401 | 3.1% | $2,061 | 8.5% | $11,671.63 | $3,462 | 29.7% |
Methodology
For this analysis, we used childcare cost data from the U.S. Department of Labor, and estimated March 2025 costs using inflation metrics. March 2025 rents are from Redfin’s median asking rent data for the three months ending March 31, 2025. Included in this analysis are the 20 U.S. metro areas for which we have sufficient childcare and inflation data.
To estimate future childcare prices at the metro level, we first calculated the average childcare prices for 2022 using county-level data from the Department of Labor. The raw data consisted of multiple files containing childcare cost information for various categories, including infant center-based, infant home-based, toddler center-based, toddler home-based, preschool center-based, and preschool home-based care. We calculated the average childcare price for each county by taking the row-wise mean of these categories. Then, to obtain metro-level average prices, we calculated population-weighted childcare price averages to ensure that counties with larger populations had a proportional influence on the final metro-level average.
Next, we calculated inflation-adjusted prices for 2023 and beyond using Bureau of Labor Statistics (BLS) data on year-over-year CPI changes for metropolitan areas. To create a consistent index, we set the average CPI for all months of 2022 as 100, establishing a stable base. The CPI for each future month was then calculated relative to the same month from the previous year. For example, the CPI for March 2023 was calculated using March 2022’s base value of 100, adjusted by the YoY change for March 2023. Similarly, the CPI for March 2024 was calculated using March 2023’s calculated CPI, adjusted again by the YoY change for March 2024. Once the CPI values were established, we estimated future childcare prices by inflating the 2022 base price using the calculated CPI values.
Written by: Dana Anderson