
With new listings rising and pending sales declining, Redfin agents suggest sellers set their asking price fairly from the start to attract buyers and avoid price drops.
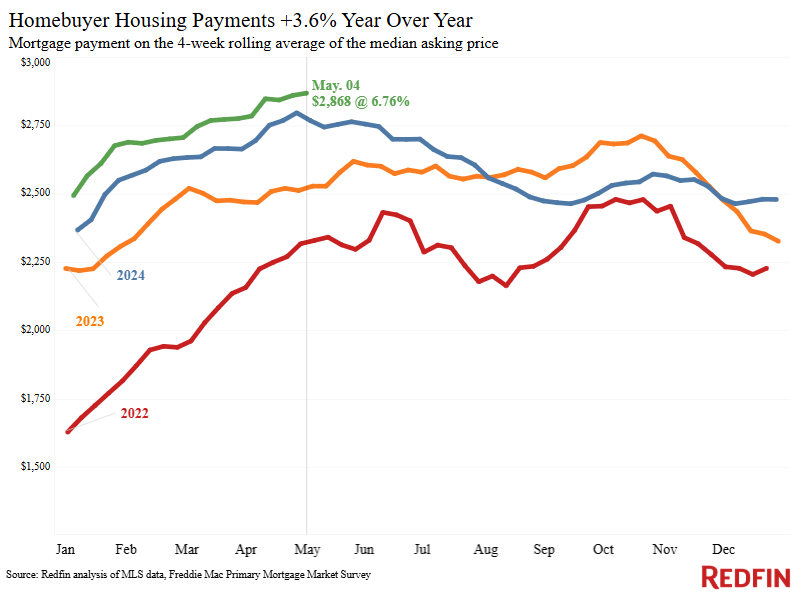
The median U.S. monthly housing payment hit an all-time high of $2,868 during the four weeks ending May 4. That’s due to two key factors: Home-sale prices are up 1.8% year over year, and the weekly average mortgage rate is 6.76%, down slightly from mid-April but elevated well above pandemic-era lows.
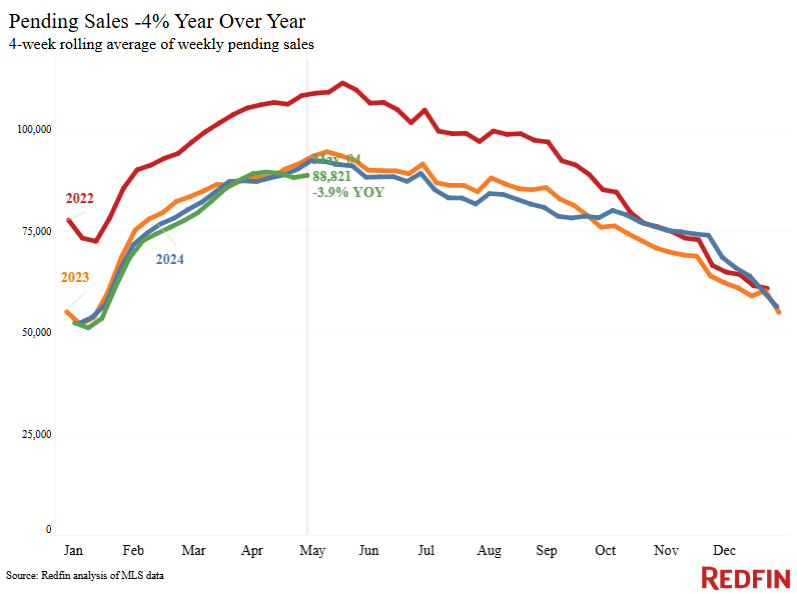
Those record-high housing costs, along with widespread economic uncertainty, are stunting this spring’s homebuying season. Mortgage-purchase applications increased last week, but they’re down 6% month over month. Additionally, pending home sales are down 3.9% year over year, the biggest decline in three months. A holiday effect is also pushing down sales; Easter fell into this year’s four-week period, but not last year’s comparable period.
Still, some house hunters are hitting the pavement. Home tours are rising faster this year than last year, according to ShowingTime data, and Redfin agents in some parts of the country report competition for turnkey homes in desirable neighborhoods.
“April is typically a busy month, but spring is off to a slow start this year,” said Nicole Stewart, a Redfin Premier agent in Boise, ID. “There are still some prospective buyers who believe mortgage rates will fall soon, and they’re waiting for that to happen. Costs are so high that buyers who are moving forward with a purchase want the home to be perfect; they’re asking sellers for more repairs and negotiating more than usual. The move-in ready, beautiful homes that are relatively affordable are the exceptions: They’re selling quickly, sometimes with multiple offers.”
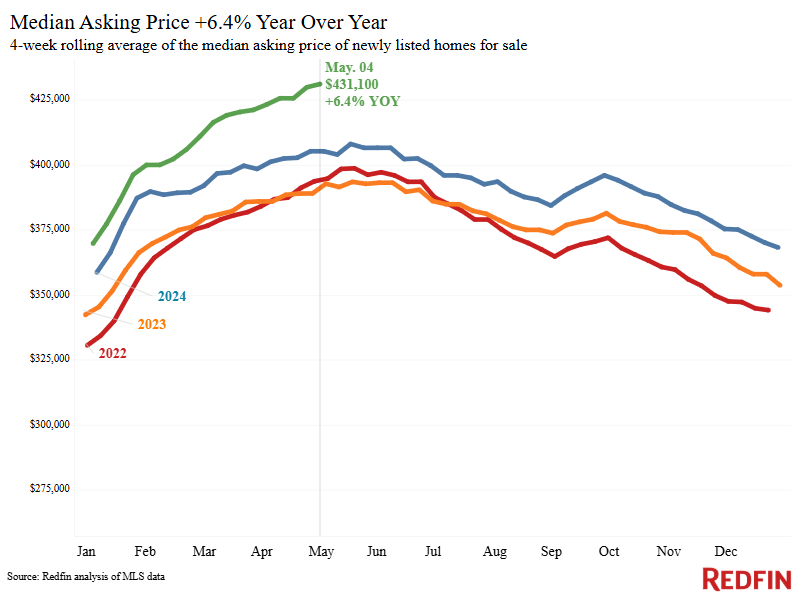
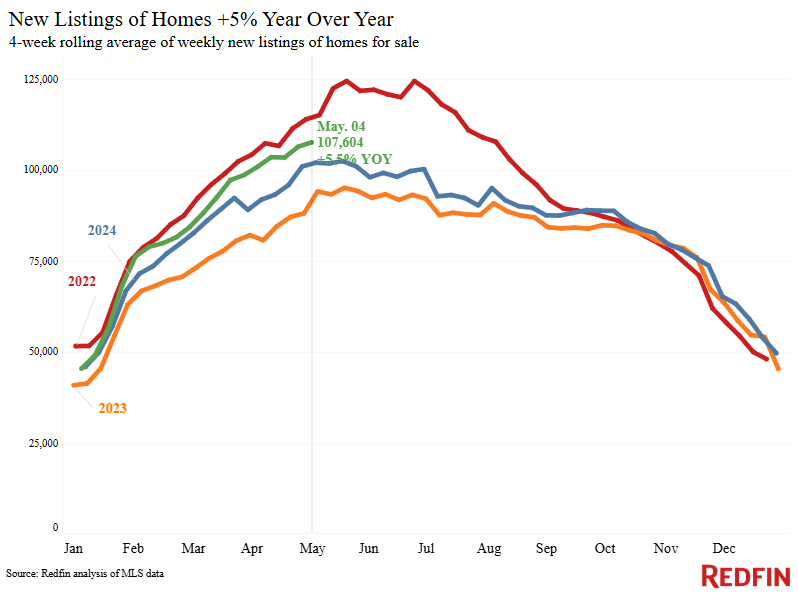
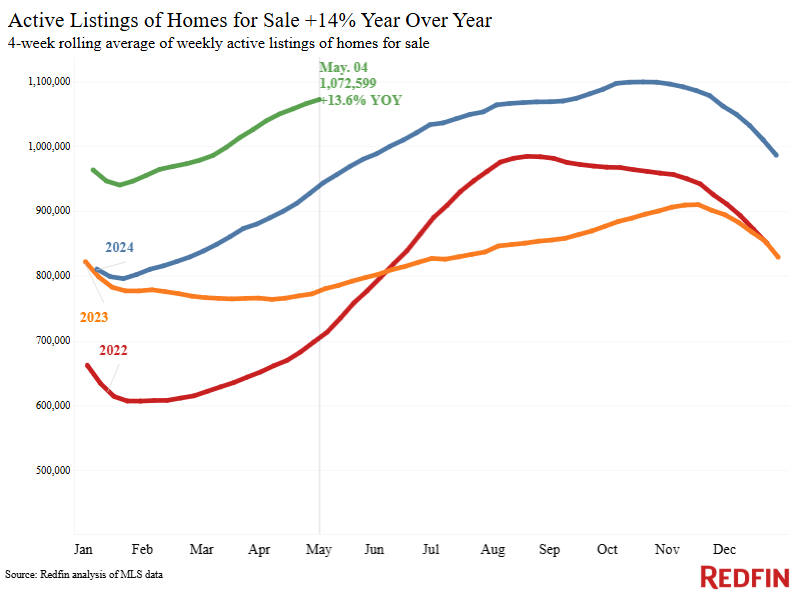
On the selling side, new listings are up 5.5% year over year. And the total number of homes for sale is increasing more, up 13.6% year over year, because sales are slow. Redfin agents suggest sellers set their asking price fairly from the start to attract buyers and avoid price drops.
For Redfin economists’ takes on the housing market, please visit Redfin’s “From Our Economists” page.
Leading indicators
| Indicators of homebuying demand and activity | ||||
| Value (if applicable) | Recent change | Year-over-year change | Source | |
| Daily average 30-year fixed mortgage rate | 6.86% (May 7) | Up from 6.81% one week earlier | Down from 7.37% | Mortgage News Daily |
| Weekly average 30-year fixed mortgage rate | 6.76% (week ending May 1) | Up from 6.62% three weeks earlier, but down slightly from one week earlier | Down from 7.22% | Freddie Mac |
| Mortgage-purchase applications (seasonally adjusted) | Up 11% from a week earlier (as of week ending May 2) | Up 13% | Mortgage Bankers Association | |
| Touring activity | Up 41% from the start of the year (as of May 5) | At this time last year, it was up 32% from the start of 2024 | ShowingTime, a home touring technology company | |
| Google searches for “home for sale” | Up 6% from a month earlier (as of May 5) | Up 10% | Google Trends | |
| We excluded the Redfin Homebuyer Demand Index this week to ensure data accuracy. | ||||
Key housing-market data
| U.S. highlights: Four weeks ending May 4, 2025
Redfin’s national metrics include data from 400+ U.S. metro areas, and are based on homes listed and/or sold during the period. Weekly housing-market data goes back through 2015. Subject to revision. |
|||
| Four weeks ending May 4, 2025 | Year-over-year change | Notes | |
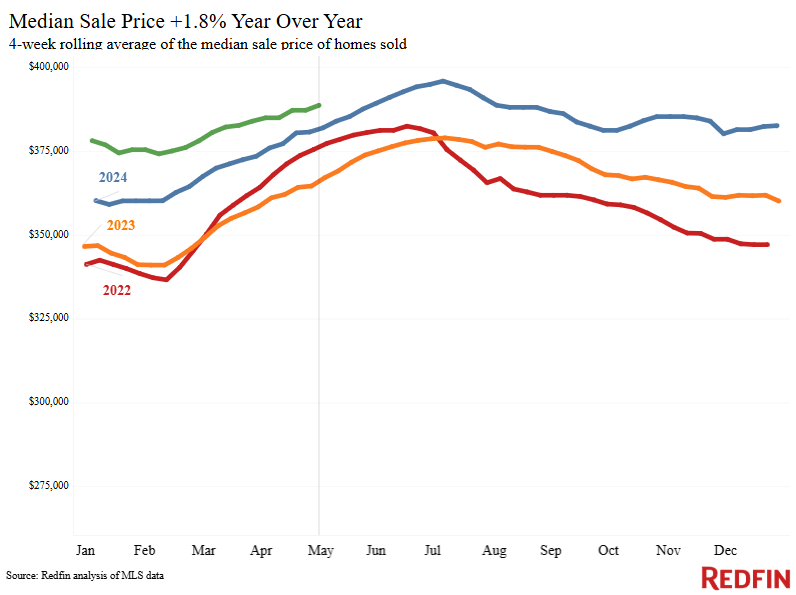
| Median sale price | $388,750 | 1.8% | |
| Median asking price | $431,100 | 6.4% | |
| Median monthly mortgage payment | $2,868 at a 6.76% mortgage rate | 3.6% | Record high |
| Pending sales | 88,821 | -3.9% | Biggest decline in 3 months |
| New listings | 107,604 | 5.5% | |
| Active listings | 1,072,599 | 13.6% | Smallest increase in over a year |
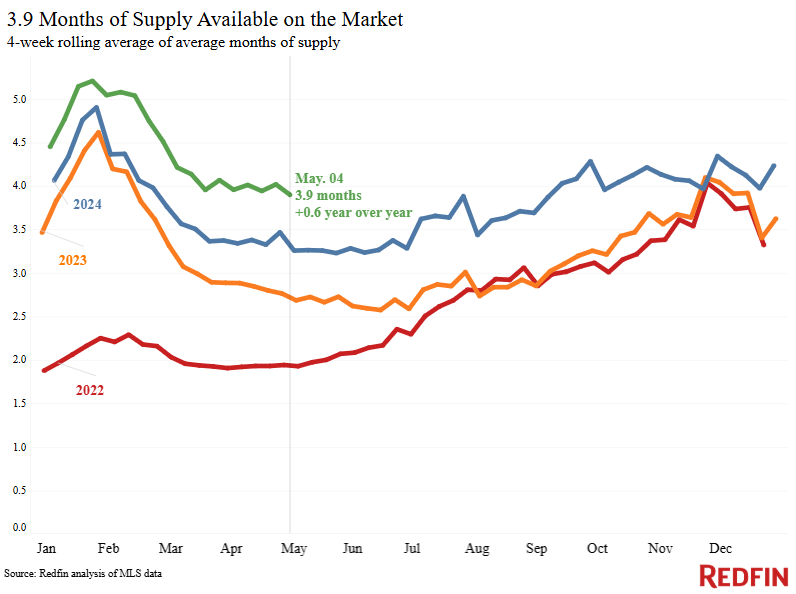
| Months of supply | 3.9 | +0.6 pts. | 4 to 5 months of supply is considered balanced, with a lower number indicating seller’s market conditions |
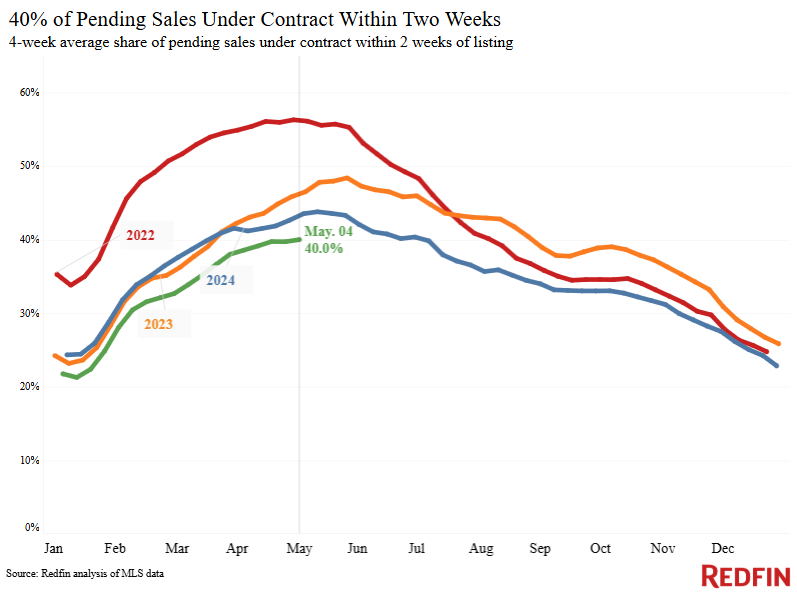
| Share of homes off market in two weeks | 40% | Down from 44% | |
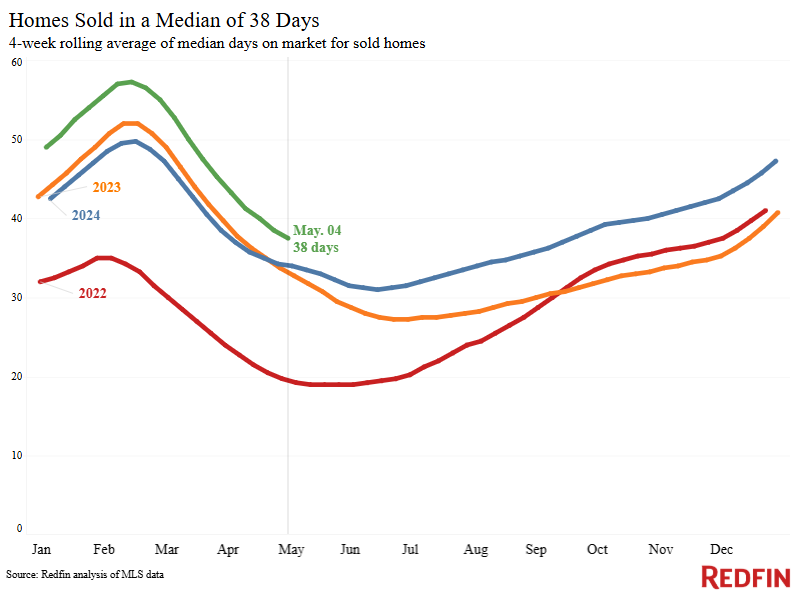
| Median days on market | 38 | +4 days | |
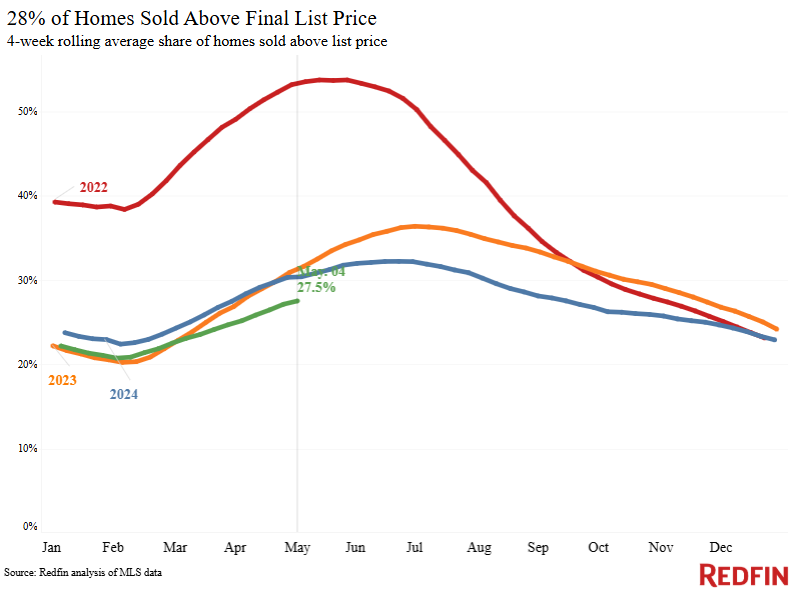
| Share of homes sold above list price | 27.5% | Down from 30% | |
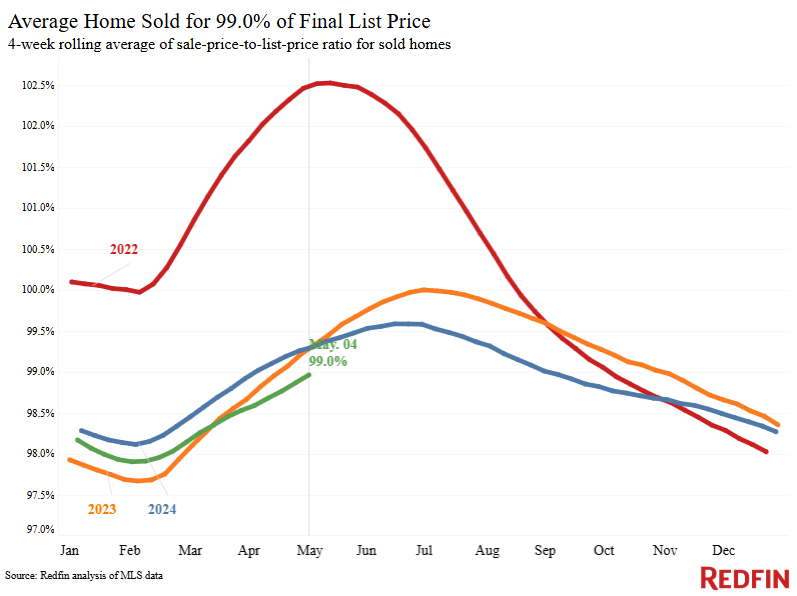
| Average sale-to-list price ratio | 99% | Down from 99.4% | |
|
Metro-level highlights: Four weeks ending May 4, 2025 Redfin’s metro-level data includes the 50 most populous U.S. metros. Select metros may be excluded from time to time to ensure data accuracy. |
|||
|---|---|---|---|
| Metros with biggest year-over-year increases | Metros with biggest year-over-year decreases | Notes | |
| Median sale price | Newark, NJ (13.5%)
Pittsburgh (8.8%) Detroit (8.7%) Philadelphia (8.7%) Nassau County, NY (8%) |
Oakland, CA (-6.7%)
Phoenix (-3.5%) Jacksonville, FL (-2.7%) Austin, TX (-2.1%) Tampa, FL (-1.6%) |
Declined in 11 metros |
| Pending sales | Indianapolis (6.4%)
Detroit (5.7%) Warren, MI (4.9%) Columbus, OH (4.4%) Virginia Beach, VA (3.4%) |
Miami (-22.6%)
Fort Lauderdale, FL (-20.3%) Anaheim, CA (-13.7%) San Jose, CA (-13.3%) West Palm Beach, FL (-13.2%) |
|
| New listings | Washington, D.C. (16.3%)
Las Vegas (15%) Phoenix (14.4%) Denver (14.3%) Boston (14%) |
San Antonio (-9.9%)
Nassau County, NY (-8.6%) Orlando, FL (-5.4%) West Palm Beach, FL (-5%) Fort Lauderdale, FL (-4.4%) |
|
Refer to our metrics definition page for explanations of all the metrics used in this report.
Written by: Dana Anderson