
Mortgage-purchase applications are declining and pending home sales are sluggish.
The 2025 spring homebuying season is lackluster, with record-high housing costs and widespread economic instability keeping would-be homebuyers at bay.
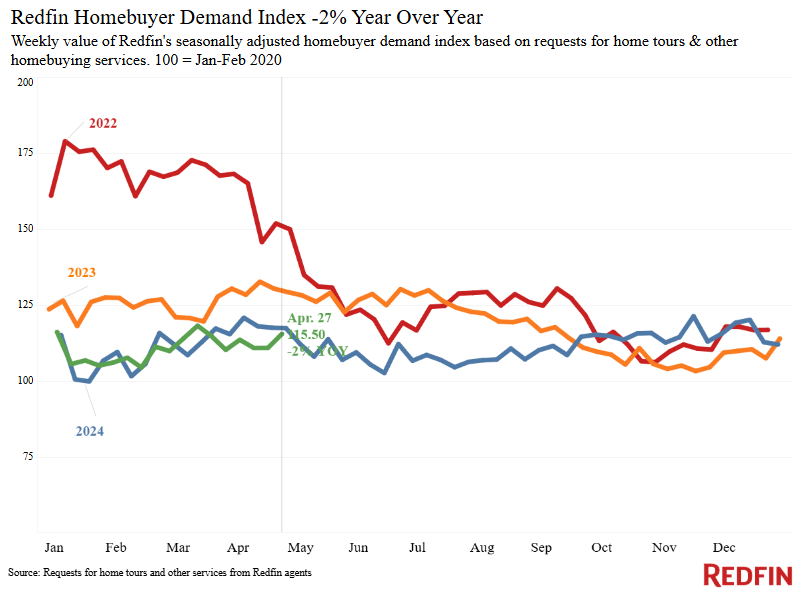
Mortgage-purchase applications are down 6% month over month, and Redfin’s Homebuyer Demand Index–a measure of tours and other buying services from Redfin agents–is essentially flat.
Pending home sales fell, too, declining 2.8% year over year nationwide during the four weeks ending April 27. That dip is mainly due to a holiday effect–Easter fell into this year’s four-week period, but not in the comparable period in 2024–but even without that effect, pending sales would likely be flat from a year ago. Sales were sluggish last spring, and they’re sluggish again this spring.
There are two key reasons a lot of prospective house hunters are staying on the sidelines:
- Record-high housing costs. The median U.S. monthly housing payment is at an all-time high of $2,870, due to still-rising home prices and elevated mortgage rates.
- Economic uncertainty. Many Americans are holding off on major purchases because they’re uncertain about the future of the economy due to things like tariffs and the increasing odds of a recession.
“A lot of people who would normally be making moves right now are standing still,” said Bliss Ong, a Redfin Premier agent in Seattle. “They want to ride out this period of economic uncertainty and wait until they feel more secure to make this huge financial decision. The people who are buying are picky; for instance, buyers aren’t making offers if a home is on a busy street, or if it has one bathroom instead of two bathrooms. When the market was hotter, those homes would fly off the shelves despite not checking every single box.”
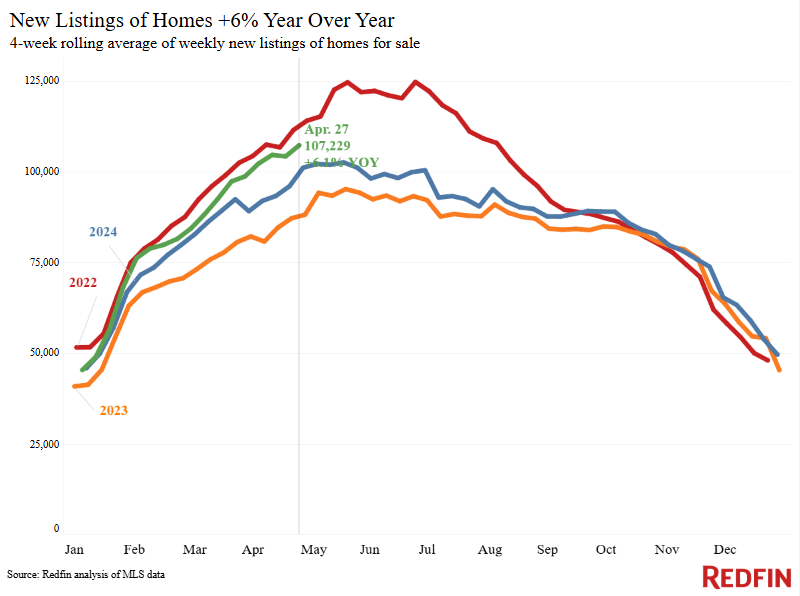
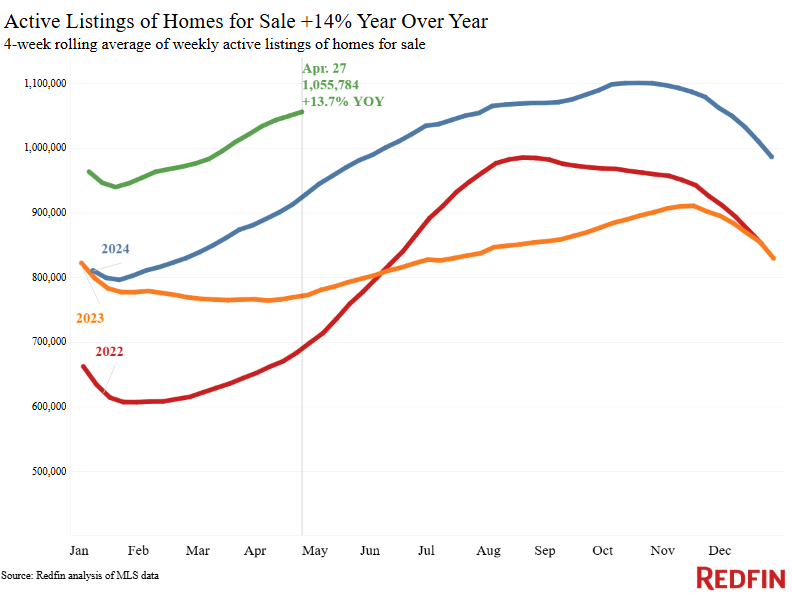
Redfin agents in many parts of the country say they’re seeing more action from sellers than buyers. New listings are up 6.1% year over year, and the total number of homes for sale is up 13.7%.
For Redfin economists’ takes on the housing market, please visit Redfin’s “From Our Economists” page.
Leading indicators
| Indicators of homebuying demand and activity | ||||
| Value (if applicable) | Recent change | Year-over-year change | Source | |
| Daily average 30-year fixed mortgage rate | 6.81% (April 30) | Down from 7.07% two weeks earlier | Down from 7.51% | Mortgage News Daily |
| Weekly average 30-year fixed mortgage rate | 6.81% (week ending April 24) | Up from 6.62% two weeks earlier, but down slightly from one week earlier | Down from 7.17% | Freddie Mac |
| Mortgage-purchase applications (seasonally adjusted) | Down 4% from a week earlier (as of week ending April 25) | Up 3% | Mortgage Bankers Association | |
| Redfin Homebuyer Demand Index (seasonally adjusted) | Essentially unchanged from a month earlier | Down 2% | A measure of home hours and other homebuying services from Redfin agentes | |
| Touring activity | Up 42% from the start of the year (as of April 30) | At this time last year, it was up 32% from the start of 2024 | ShowingTime, a home touring technology company | |
| Google searches for “home for sale” | Unchanged from a month earlier (as of April 28) | Up 8% | Google Trends | |
Key housing-market data
| U.S. highlights: Four weeks ending April 27, 2025
Redfin’s national metrics include data from 400+ U.S. metro areas, and are based on homes listed and/or sold during the period. Weekly housing-market data goes back through 2015. Subject to revision. |
|||
| Four weeks ending April 27, 2025 | Year-over-year change | Notes | |
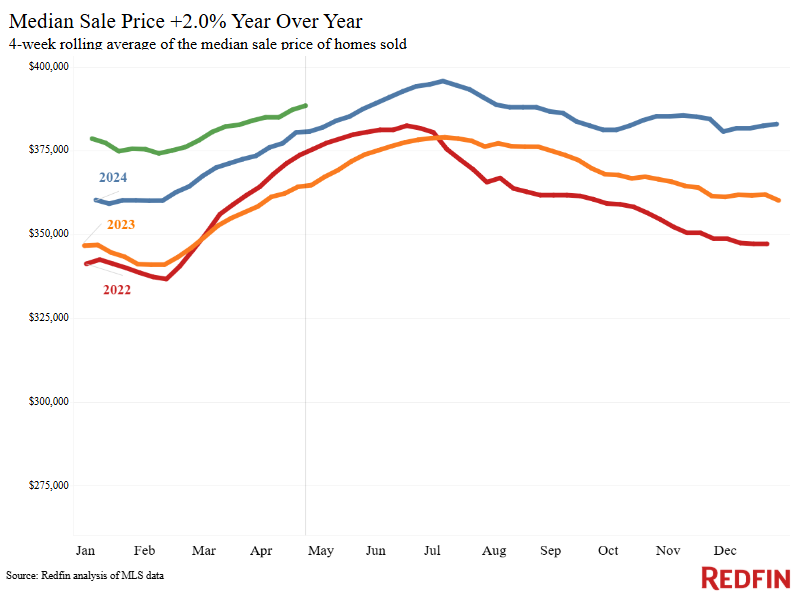
| Median sale price | $388,475 | 2% | |
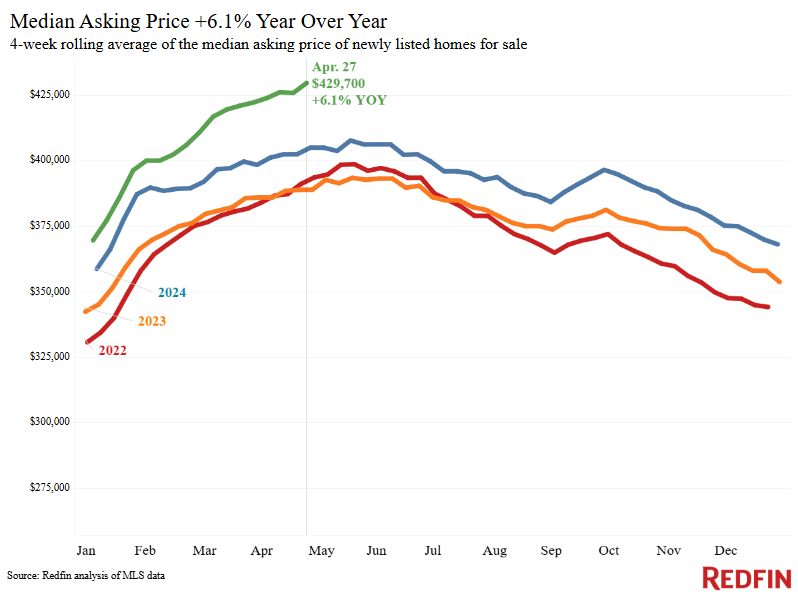
| Median asking price | $429,700 | 6.1% | |
| Median monthly mortgage payment | $2,870 at a 6.81% mortgage rate | 2.7% | Record high |
| Pending sales | 87,876 | -2.8% | |
| New listings | 107,229 | 6.1% | |
| Active listings | 1,055,784 | 13.7% | Smallest increase in over a year |
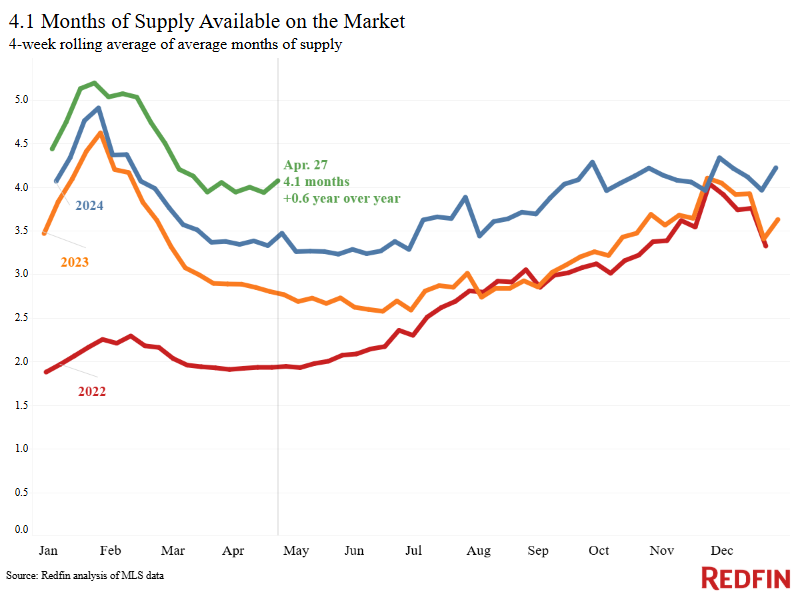
| Months of supply | 4.1 | +0.6 pts. | 4 to 5 months of supply is considered balanced, with a lower number indicating seller’s market conditions |
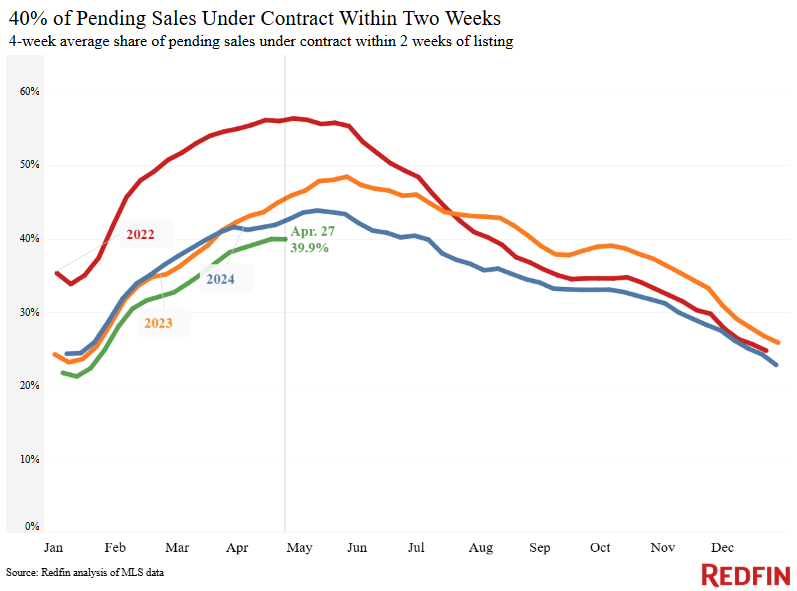
| Share of homes off market in two weeks | 39.9% | Down from 43% | |
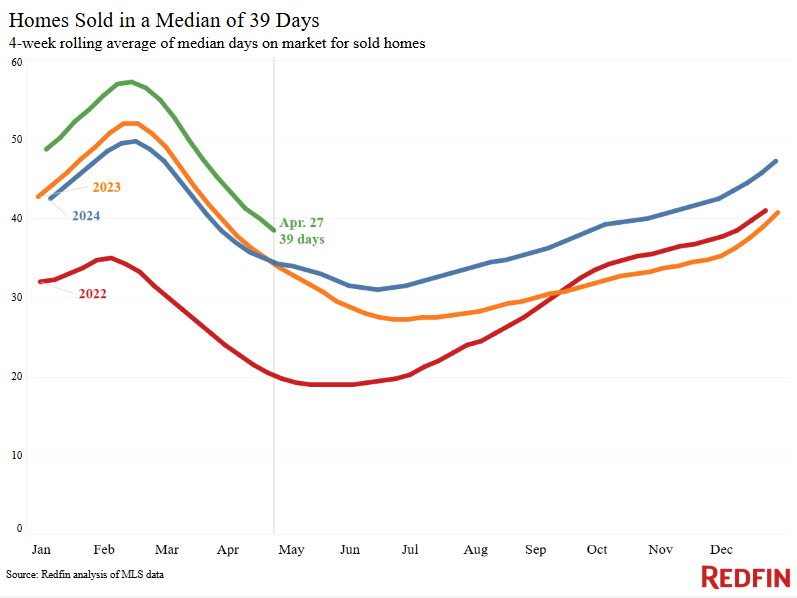
| Median days on market | 39 | +5 days | |
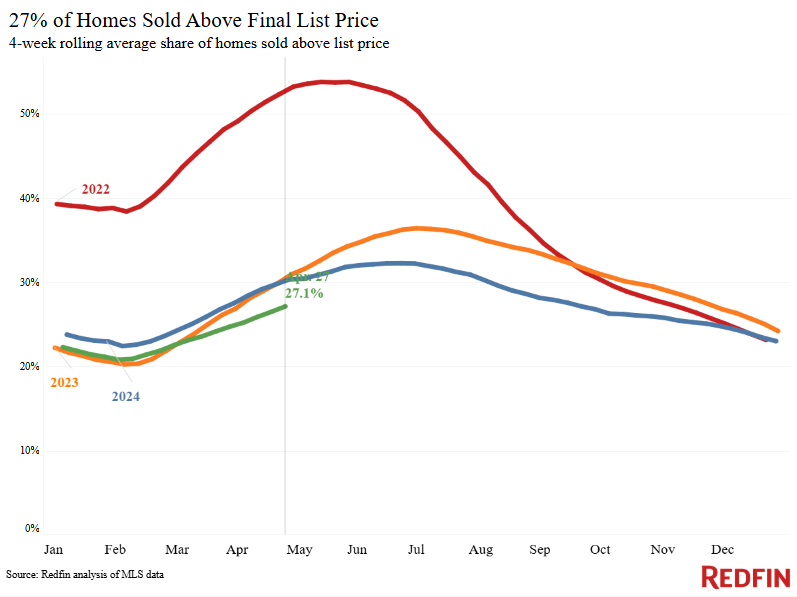
| Share of homes sold above list price | 27.1% | Down from 31% | |
| Average sale-to-list price ratio | 98.9% | Down from 99.3% | |
|
Metro-level highlights: Four weeks ending April 27, 2025 Redfin’s metro-level data includes the 50 most populous U.S. metros. Select metros may be excluded from time to time to ensure data accuracy. |
|||
|---|---|---|---|
| Metros with biggest year-over-year increases | Metros with biggest year-over-year decreases |
Notes |
|
| Median sale price | Newark, NJ (11.3%)
Milwaukee (10.3%) Cleveland (7.6%) New Brunswick, NJ (7.5%) Chicago (7.3%) |
Oakland, CA (-5%)
San Antonio (-3.5%) Phoenix (-2.9%) Austin, TX (-2.5%) Jacksonville, FL (-2.3%) |
Declined in 9 metros |
| Pending sales | Columbus, OH (13.8%)
Warren, MI (9.1%) Boston (8.5%) Indianapolis (6.2%) Detroit (5.9%) |
Miami (-23.8%)
Fort Lauderdale, FL (-19.5%) West Palm Beach, FL (-15.4%) Houston (-13.1%) Las Vegas (-13%) |
|
| New listings | Phoenix (20.3%)
Washington, D.C. (15.6%) Baltimore (15%) Las Vegas (13.8%) Denver (12.8%) |
Nassau County, NY (-7.4%)
Newark, NJ (-5.5%) San Jose, CA (-5.3%) New York, NY (-5.1%) West Palm Beach, FL (-4.8%) |
|
Refer to our metrics definition page for explanations of all the metrics used in this report.


Written by: Dana Anderson