
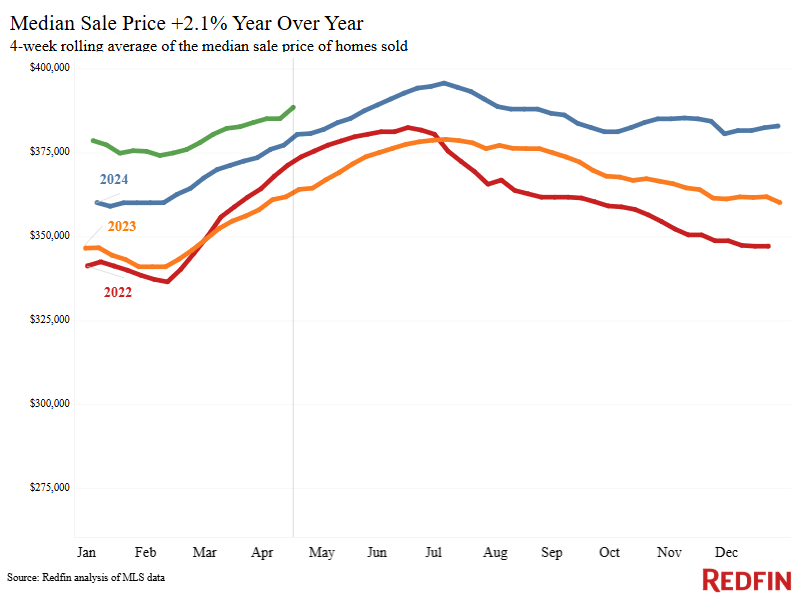
Nationwide, home prices are up 2.1% year over year, the slowest growth rate in nearly two years.
The median home-sale price declined year over year in 11 of the 50 most populous U.S. metro areas during the four weeks ending April 20. The last time home prices dropped in that many metros was over a year and a half ago, in September 2023. Prices declined most in San Antonio (-3.7%), Oakland, CA (-3.5%), and Jacksonville, FL (-2.2%). The other places where prices fell were Phoenix, Austin, TX, Dallas, Orlando, Sacramento, CA, Fort Worth, TX, Portland, OR and Nashville, TN.
Nationwide, the median home-sale price rose 2.1% year over year, the slowest growth rate since July 2023.
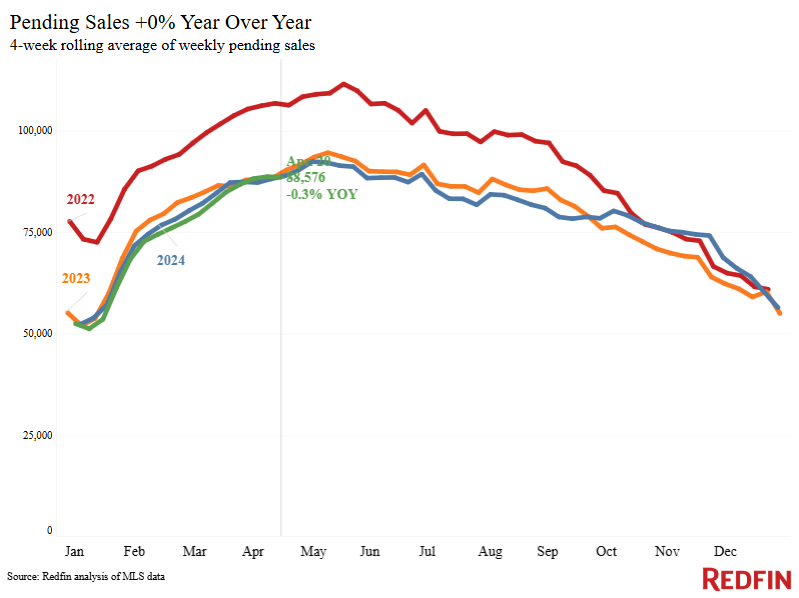
Home prices are falling in many major metros–and price growth is decelerating nationally–because many house hunters are backing off, but the number of homes for sale is holding up. Home tours are slowing, mortgage-purchase applications are falling, and Redfin agents in many parts of the country report that would-be buyers are ultra-cautious amid high housing costs and widespread economic uncertainty. Pending home sales are down slightly year over year (-0.3%).
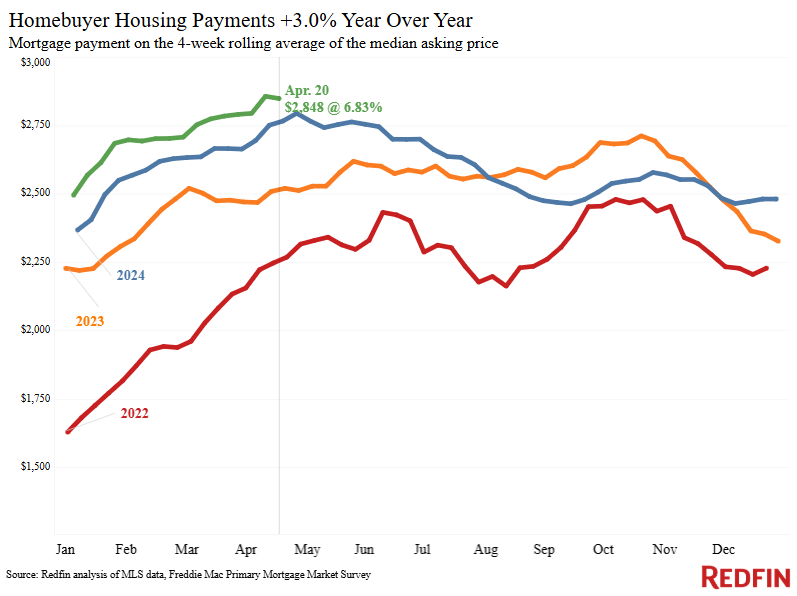
The median U.S. monthly housing payment is $2,848, just $8 shy of the all-time high, as weekly average mortgage rates jumped to 6.83% from 6.62% in just one week. Mortgage rates are rising for the same reason many buyers are backing off: Economic instability and the increasing chances of a recession, largely stemming from new tariffs.
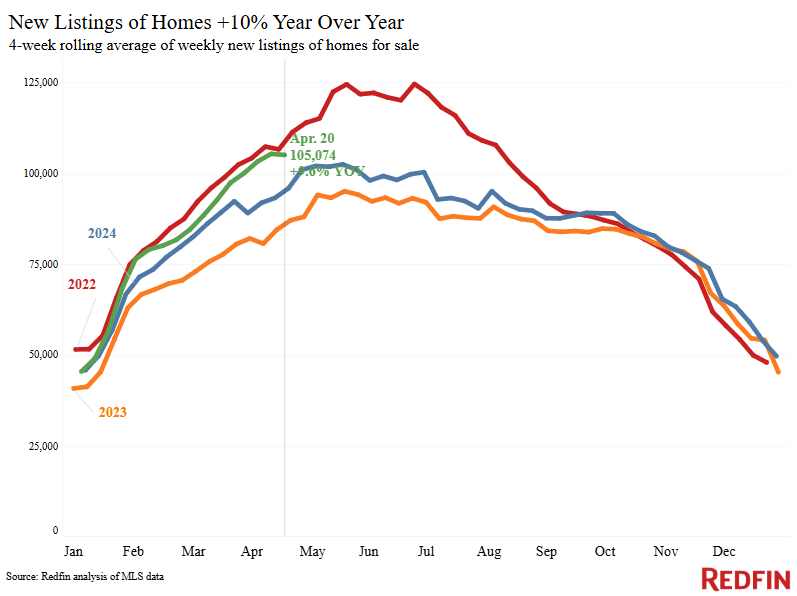
Meanwhile, new listings are up 9.6% year over year, and Redfin agents report that much of the activity they’re seeing in the market is from sellers.
“There are always people who need to buy homes or sell homes, no matter what’s going on in the world. But with so much uncertainty in the economy, now is a time for those buyers and sellers to be more strategic than ever,” said Chen Zhao, Redfin’s Economic Research Lead. “My advice to sellers is to price your home fairly for the shifting market; you may need to price lower than your initial instinct to sell quickly and avoid giving concessions. On the flip side, buyers should negotiate on price and terms and shop around even more than usual for the best mortgage rates.”
For Redfin economists’ takes on the housing market, please visit Redfin’s “From Our Economists” page.
Leading indicators
| Indicators of homebuying demand and activity | ||||
| Value (if applicable) | Recent change | Year-over-year change | Source | |
| Daily average 30-year fixed mortgage rate | 6.94% (April 23) | Down from 7.07% a week earlier | Down from 7.41% | Mortgage News Daily |
| Weekly average 30-year fixed mortgage rate | 6.83% (week ending April 17) | Up from 6.62% a week earlier | Down from 7.1% | Freddie Mac |
| Mortgage-purchase applications (seasonally adjusted) | Down 7% from a week earlier (as of week ending April 18) | Up 6% | Mortgage Bankers Association | |
| Touring activity | Up 16% from the start of the year (as of April 21) | At this time last year, it was up 35% from the start of 2024 | ShowingTime, a home touring technology company | |
| Google searches for “home for sale” | Up 6% from a month earlier (as of April 21) | Unchanged | Google Trends | |
| We excluded the Redfin Homebuyer Demand Index this week to ensure data accuracy. | ||||
Key housing-market data
| U.S. highlights: Four weeks ending April 20, 2025
Redfin’s national metrics include data from 400+ U.S. metro areas, and are based on homes listed and/or sold during the period. Weekly housing-market data goes back through 2015. Subject to revision. |
|||
| Four weeks ending April 20, 2025 | Year-over-year change | Notes | |
| Median sale price | $388,562 | 2.1% | Slowest growth since July 2023 (tied with the prior 4-week period, the 4 weeks ending April 13, 2025) |
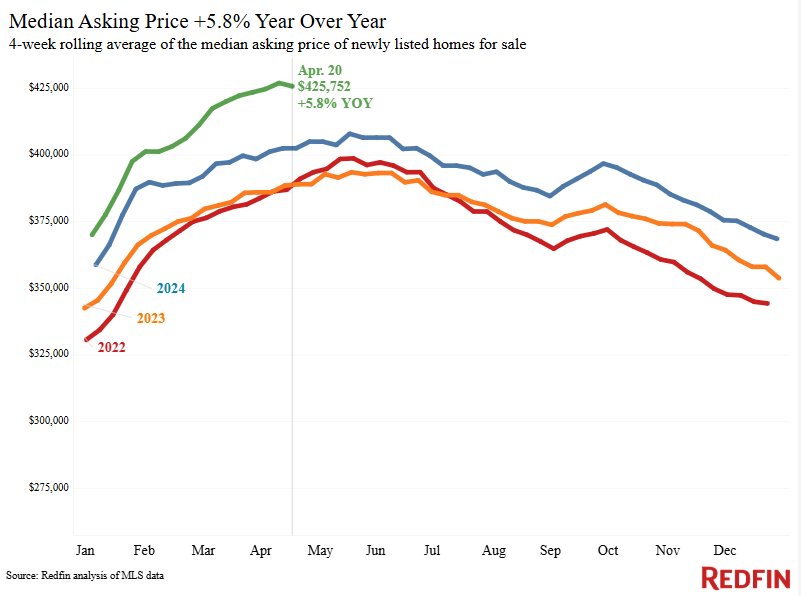
| Median asking price | $425,752 | 5.8% | |
| Median monthly mortgage payment | $2,848 at a 6.83% mortgage rate | 3% | $8 shy of record high |
| Pending sales | 88,576 | -0.3% | |
| New listings | 105,074 | 9.6% | |
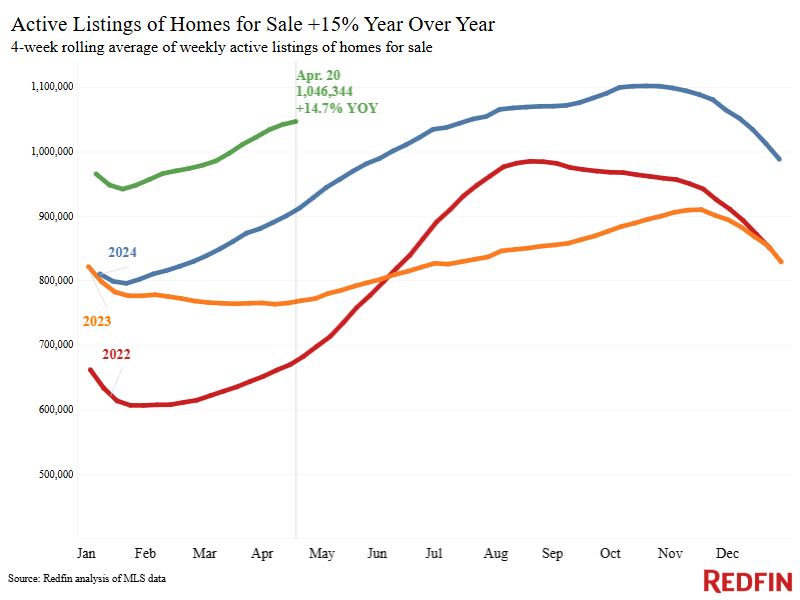
| Active listings | 1,046,344 | 14.7% | Smallest increase in over a year |
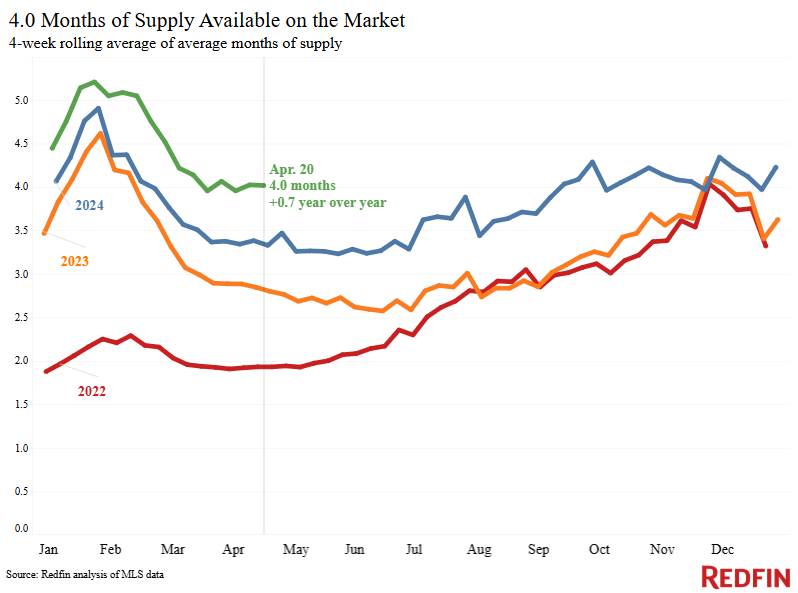
| Months of supply | 4 | +0.7 pts. | 4 to 5 months of supply is considered balanced, with a lower number indicating seller’s market conditions |
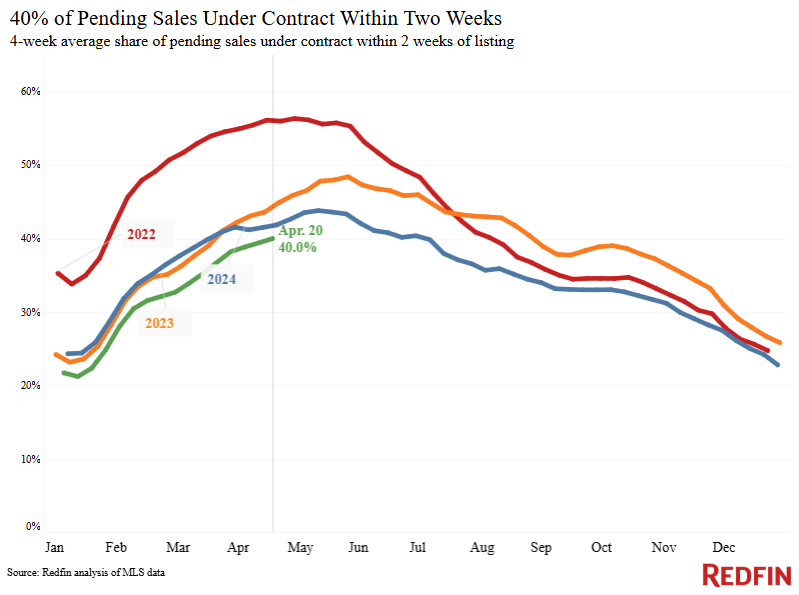
| Share of homes off market in two weeks | 40% | Down from 42% | |
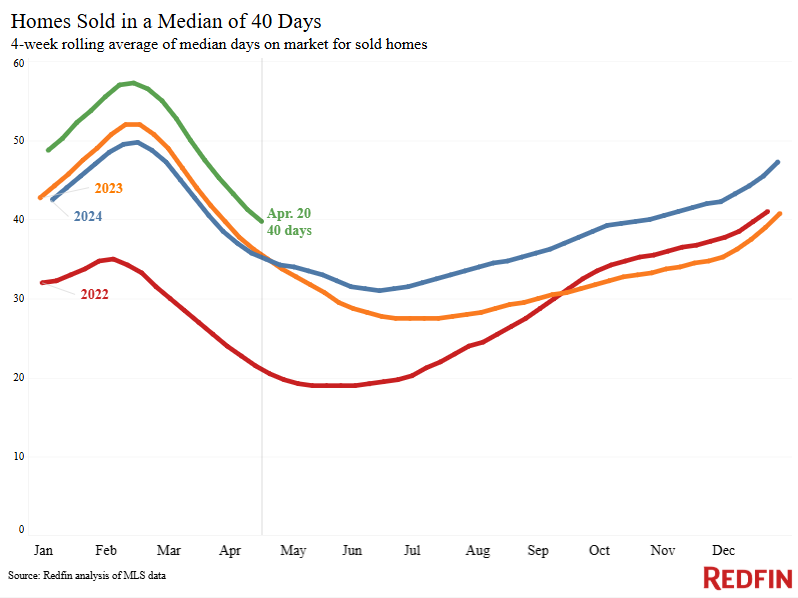
| Median days on market | 40 | +5 days | |
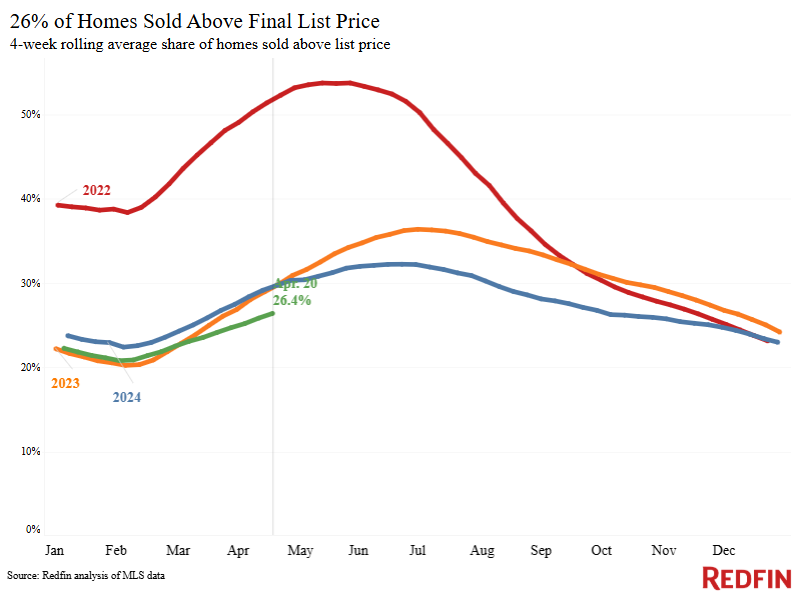
| Share of homes sold above list price | 26.4% | Down from 30% | |
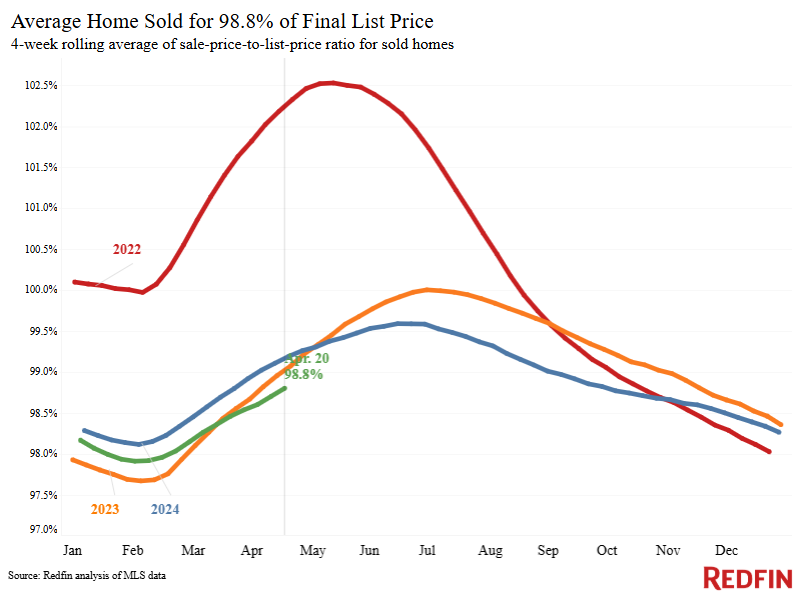
| Average sale-to-list price ratio |
98.8% |
Down from 99.3% | |
|
Metro-level highlights: Four weeks ending April 20, 2025 Redfin’s metro-level data includes the 50 most populous U.S. metros. Select metros may be excluded from time to time to ensure data accuracy. |
|||
|---|---|---|---|
| Metros with biggest year-over-year increases | Metros with biggest year-over-year decreases |
Notes |
|
| Median sale price | Milwaukee (11.7%)
Newark, NJ (11.2%) Cleveland (9.5%) Chicago (7.7%) Baltimore (7%) |
San Antonio (-3.7%)
Oakland, CA (-3.5%) Jacksonville, FL (-2.2%) Phoenix (-2%) Austin, TX (-1.3%) |
Declined in 11 metros |
| Pending sales | Columbus, OH (16.4%)
Boston (14.3%) Cincinnati (12.3%) Indianapolis (12.1%) San Francisco (8.5%) |
Miami (-25.6%)
Fort Lauderdale, FL (-17.9%) West Palm Beach, FL (-15.3%) Las Vegas (-14.7%) Houston (-11.8%) |
Declined in roughly half the metros |
| New listings | Phoenix (24.9%)
Boston (20.4%) Washington, D.C. (20%) Baltimore (18.9%) Cleveland (17.2%) |
Nassau County, NY (-6.2%)
West Palm Beach, FL (-2.6%) Fort Lauderdale, FL (-2.3%) New York (-2.3%) San Antonio (-2.3%) Newark, NJ (-0.4%) |
Declined in 6 metros |
Refer to our metrics definition page for explanations of all the metrics used in this report.
Written by: Dana Anderson