
The median monthly U.S. mortgage payment is just $25 shy of its record high, sidelining would-be buyers. But the tide is turning for buyers: Redfin economists expect home prices to decline by the end of the year, and a surplus of listings is motivating sellers to negotiate.
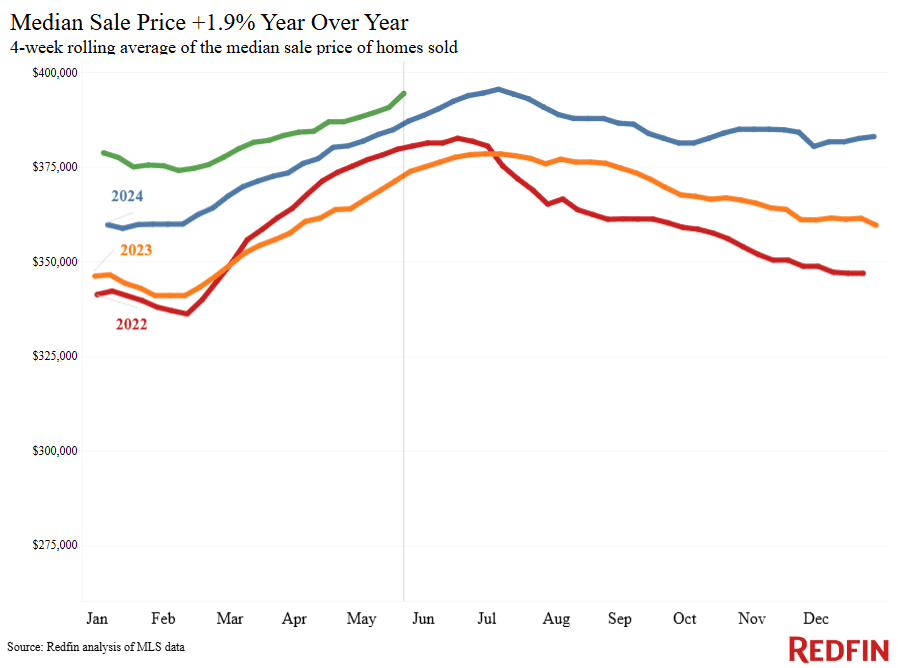
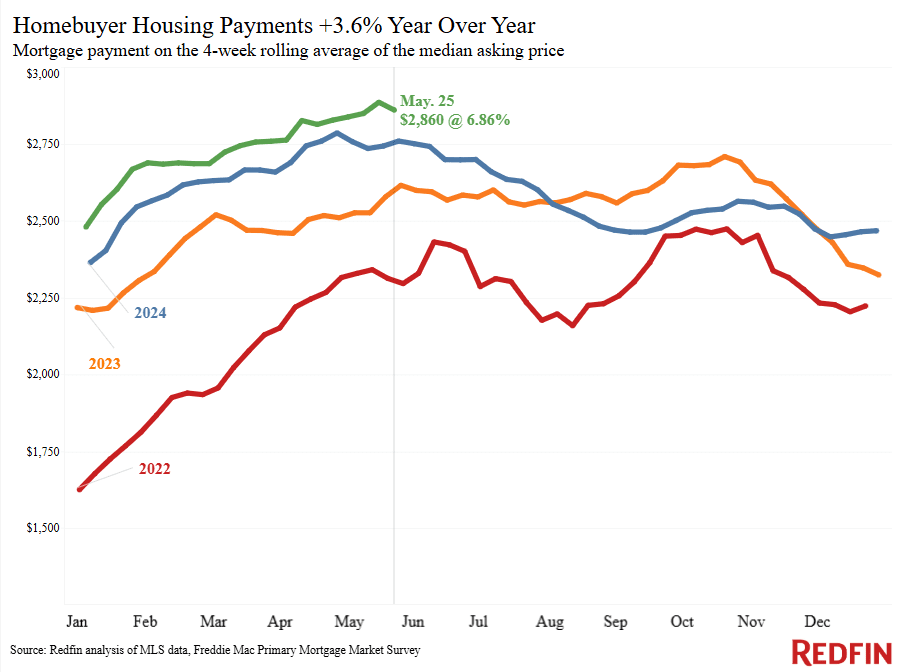
The median monthly mortgage payment nationwide was $2,860 during the four weeks ending May 25, up 3.6% year over year and just $25 shy of the all-time high. Housing payments are high for two reasons: The weekly average mortgage rate is 6.86%, the highest level in three months, and the median U.S. home-sale price is up 1.9% year over year.
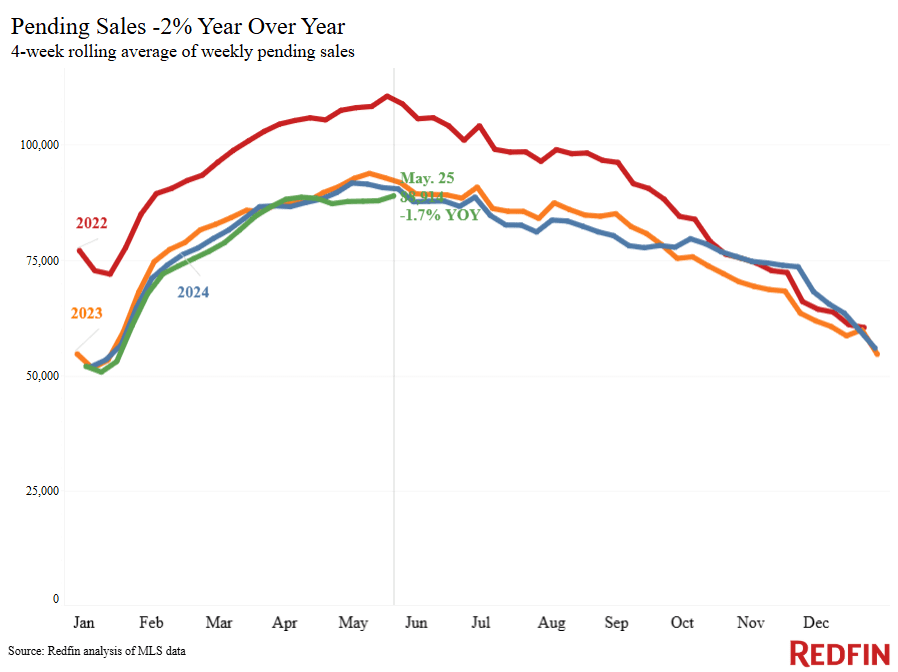
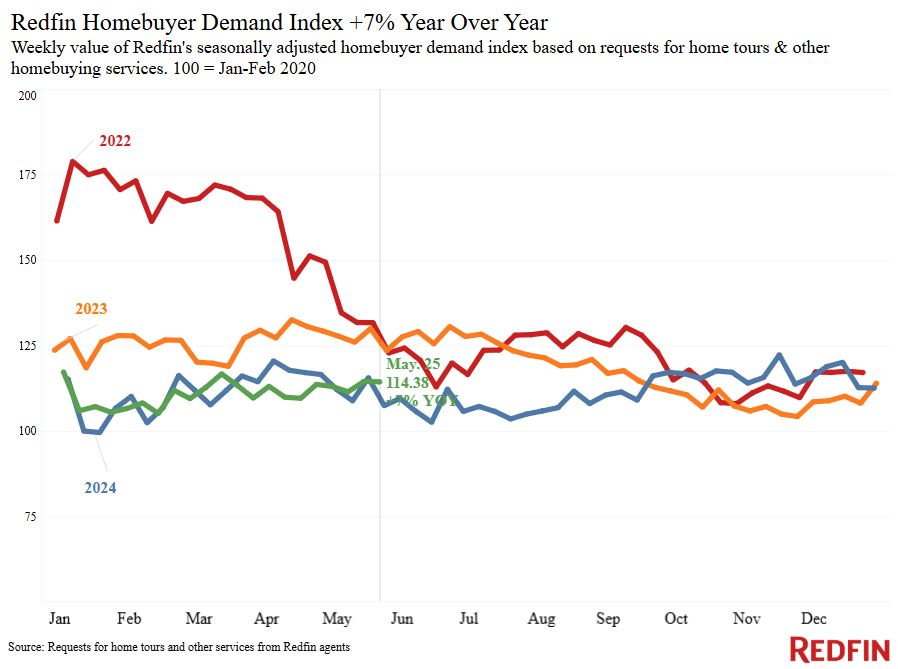
High costs, along with widespread economic uncertainty, are keeping would-be homebuyers at bay. Pending home sales are down 1.7% from a year ago, and Redfin’s Homebuyer Demand Index–a measure of tours and other buying services from Redfin agents–is essentially flat from a month ago. Of the homes that are going under contract, roughly 14% of those deals are canceled, the highest share for this time of year since the housing market nearly ground to a halt at the start of the pandemic.
But the tide is starting to turn for homebuyers. Home-sale prices are already falling in 11 of the 50 most populous U.S. metro areas–the biggest declines are in Oakland, CA, Dallas, and Jacksonville, FL–and Redfin economists expect the median U.S. sale price to fall by the end of 2025. Combined with the fact that wages are forecast to continue rising, that means homebuying affordability should improve in the second half of the year.
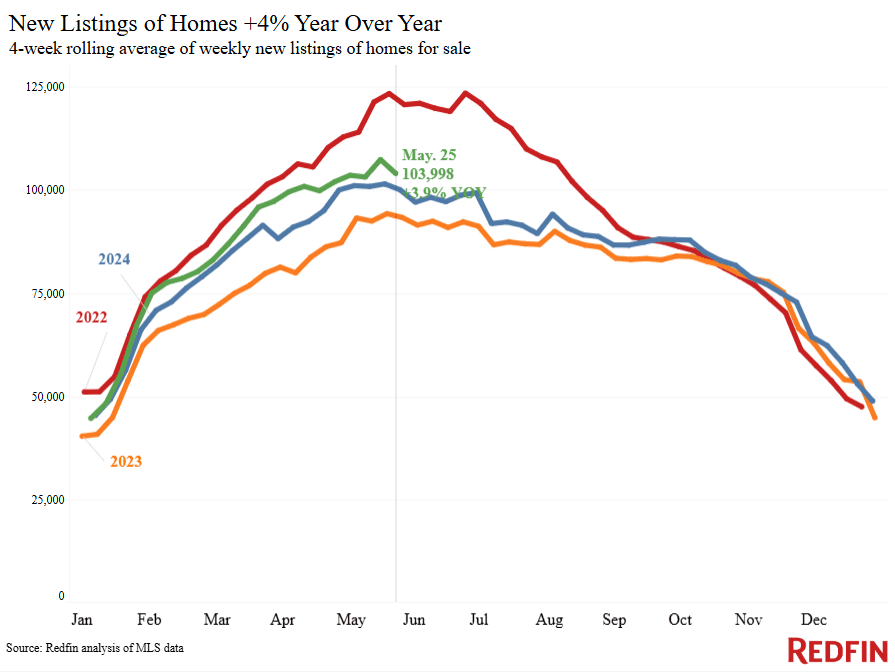
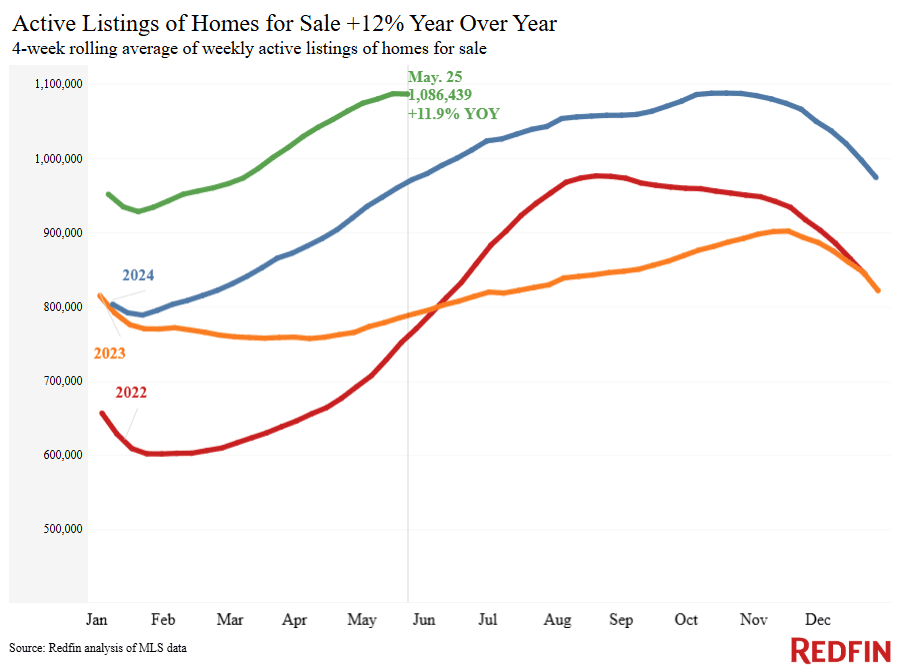
Additionally, buyers have more options and more negotiating power. New listings are up 3.9% year over year, and the total number of homes for sale is up 11.9%. Because there are more sellers than buyers in the market, buyers in many parts of the country are able to successfully negotiate prices down and get concessions.
“Sellers are realizing we’re in a new market, which is making them flexible,” said Venus Martinez, a Redfin Premier agent in Los Angeles. “A lot of sellers, especially those who may have bought at the top of the market and need to sell, are willing to accept less money for their homes, give concessions to buyers, and even negotiate commissions. Buyers are more likely to be able to negotiate if a home has been on the market for more than a few weeks, or if it has fallen out of contract.”
For Redfin economists’ takes on the housing market, please visit Redfin’s “From Our Economists” page.
Leading indicators
| Indicators of homebuying demand and activity | ||||
| Value (if applicable) | Recent change | Year-over-year change | Source | |
| Daily average 30-year fixed mortgage rate | 6.98% (May 28) | Essentially unchanged from 6.99% one week earlier | Down from 7.16% | Mortgage News Daily |
| Weekly average 30-year fixed mortgage rate | 6.86% (week ending May 22) | Up from 6.76% two weeks earlier | Down from 6.94% | Freddie Mac |
| Mortgage-purchase applications (seasonally adjusted) | Up 3% from a week earlier (as of week ending May 23) | Up 18% | Mortgage Bankers Association | |
| Redfin Homebuyer Demand Index | Up 0.7% from a month earlier (as of week ending May 25) | Up 7% | A measure of tours and other homebuying services from Redfin agents | |
| Touring activity | Up 23% from the start of the year (as of May 27) | At this time last year, it was up 17% from the start of 2024 | ShowingTime, a home touring technology company | |
| Google searches for “home for sale” | Up 8% from a month earlier (as of May 27) | Unchanged | Google Trends | |
Key housing-market data
| U.S. highlights: Four weeks ending May 25, 2025
Redfin’s national metrics include data from 400+ U.S. metro areas, and are based on homes listed and/or sold during the period. Weekly housing-market data goes back through 2015. Subject to revision. |
|||
| Four weeks ending May 25, 2025 | Year-over-year change | Notes | |
| Median sale price | $394,375 | 1.9% | |
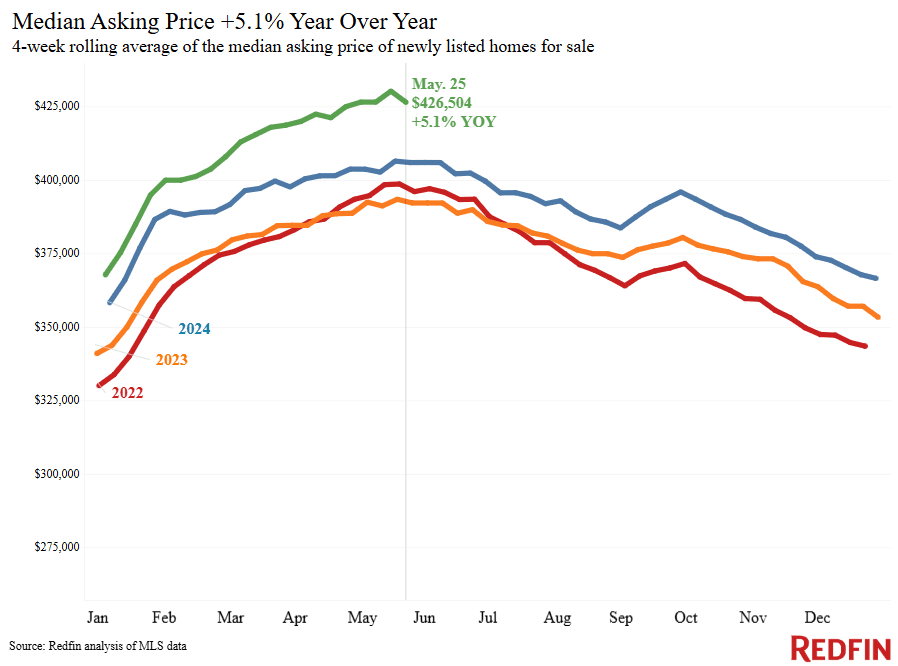
| Median asking price | $426,504 | 5.1% | |
| Median monthly mortgage payment | $2,860 at a 6.86% mortgage rate | 3.6% | $25 shy of record high |
| Pending sales | 88,914 | -1.7% | |
| New listings | 103,998 | 3.9% | |
| Active listings | 1,086,439 | 11.9% | Smallest increase in over a year |
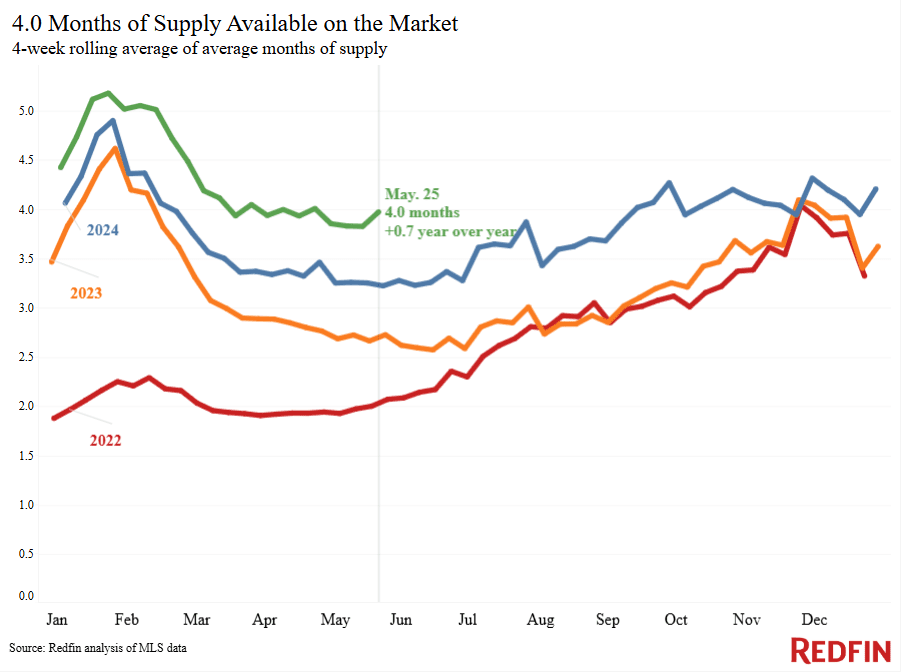
| Months of supply | 4 | +0.7 pts. | 4 to 5 months of supply is considered balanced, with a lower number indicating seller’s market conditions |
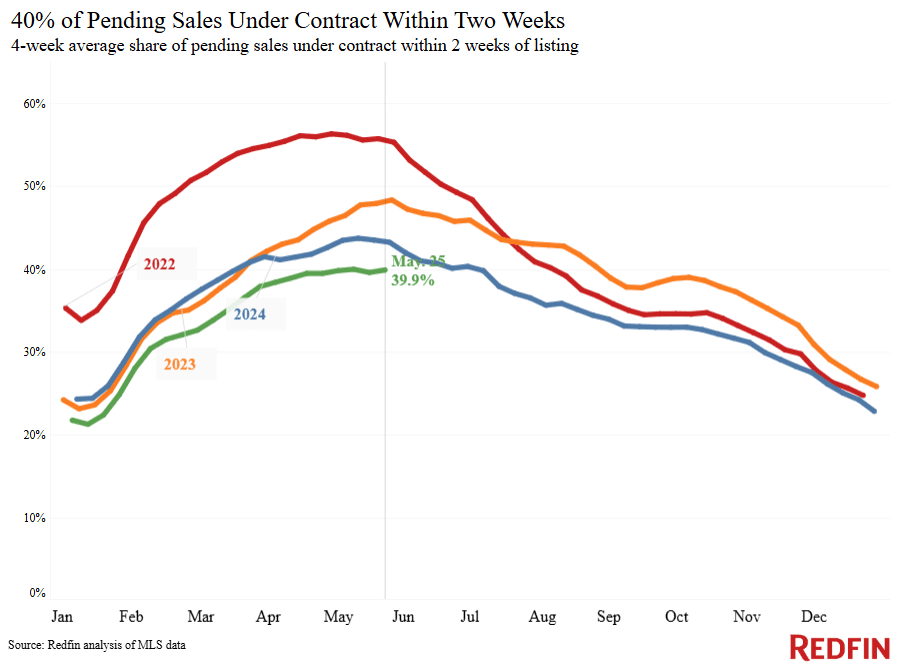
| Share of homes off market in two weeks | 39.9% | Down from 43% | |
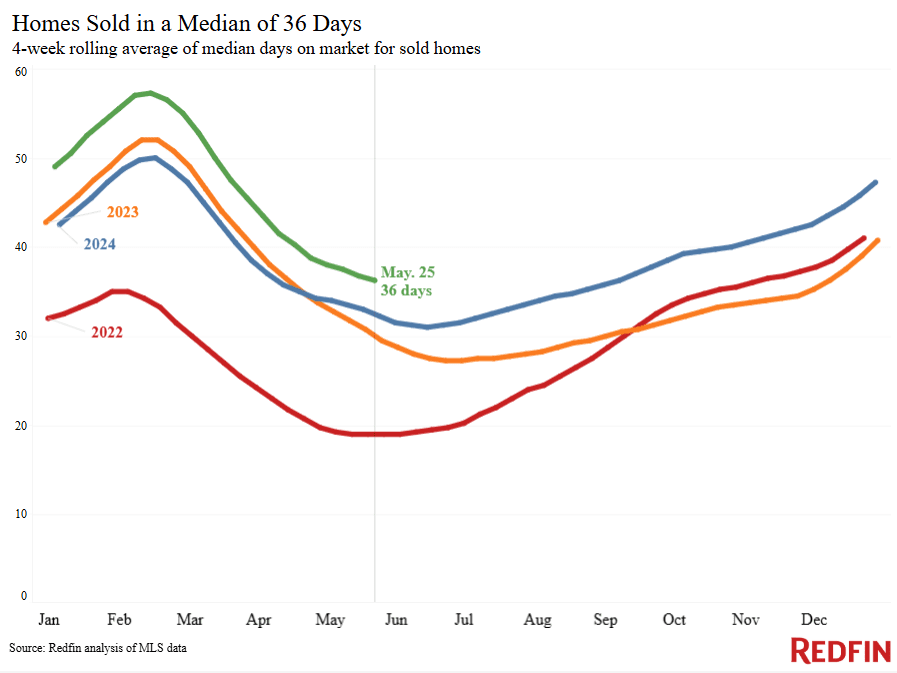
| Median days on market | 36 | +4 days | |
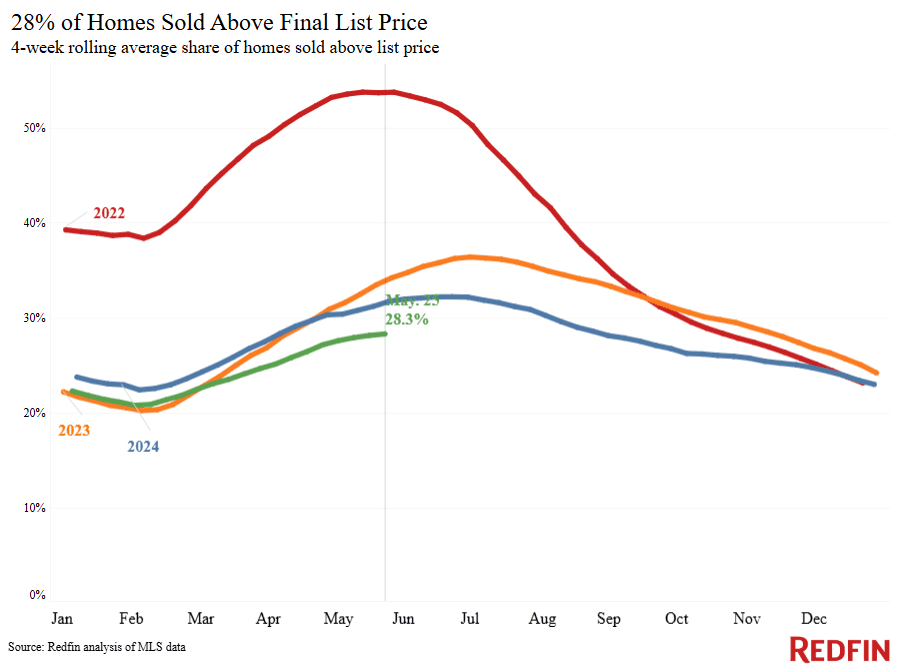
| Share of homes sold above list price | 28.3% | Down from 31% | |
| Average sale-to-list price ratio | 99.1% | Down from 99.4% | |
|
Metro-level highlights: Four weeks ending May 25, 2025 Redfin’s metro-level data includes the 50 most populous U.S. metros. Select metros may be excluded from time to time to ensure data accuracy. |
|||
|---|---|---|---|
| Metros with biggest year-over-year increases | Metros with biggest year-over-year decreases |
Notes |
|
| Median sale price | Philadelphia (15%)
Detroit (11.3%) Pittsburgh (10.1%) Miami (8.1%) New Brunswick, NJ (7.8%) |
Oakland, CA (-4.9%)
Dallas (-4.5%) Jacksonville, FL (-3%) Austin, TX (-2.5%) Seattle (-1.4%) Tampa, FL (-1.3%) Denver (-0.9%) Atlanta (-0.8%) Houston (-0.8%) Indianapolis (-0.3%) Anaheim, CA (-0.1%) |
Declined in 11 metros |
| Pending sales | Cincinnati (6.9%)
Indianapolis (5.2%) Montgomery County, PA (4.4%) Chicago (4.2%) Austin, TX (3.8%) |
Miami (-21.5%)
Fort Lauderdale, FL (-16.5%) Las Vegas (-13.2%) San Jose, CA (-12.5%) Los Angeles (-12%) |
|
| New listings | Seattle (15.6%)
Houston (14.9%) Washington, D.C. (13.7%) Boston (11.7%) Nashville, TN (10.2%) |
Orlando, FL (-12.8%)
Tampa, FL (-10%) Los Angeles (-9.4%) Fort Lauderdale, FL (-9.2%) San Antonio (-7.1%) |
|
Refer to our metrics definition page for explanations of all the metrics used in this report.

Written by: Dana Anderson