ATTOM recognized for championing employee well-being through flexible, people-first workplace culture IRVINE, Calif. – June 2, 2025 – ATTOM, a leading curator of land, property data, and real estate analytics, is proud to announce it has been named a Gold Award winner in the 2025 Merit Awards for Human Resources, honoring its commitment to work-life balance and employee well-being. The recognition celebrates ATTOM’s innovative approach to creating a flexible, inclusive, and wellness-focused remote work culture. The Merit Awards recognize the efforts of global industries and the markets they serve, honoring the individuals, teams, and organizations working to positively impact their sectors and communities. The Merit Awards for human resources were judged based on submissions that addressed leadership, innovation, positive work environment and more. ATTOM was recognized for its strategic work-life harmony initiative, which integrates flexibility, wellness, and team connectivity into everyday operations. From a fully remote model and wellness incentives to virtual …
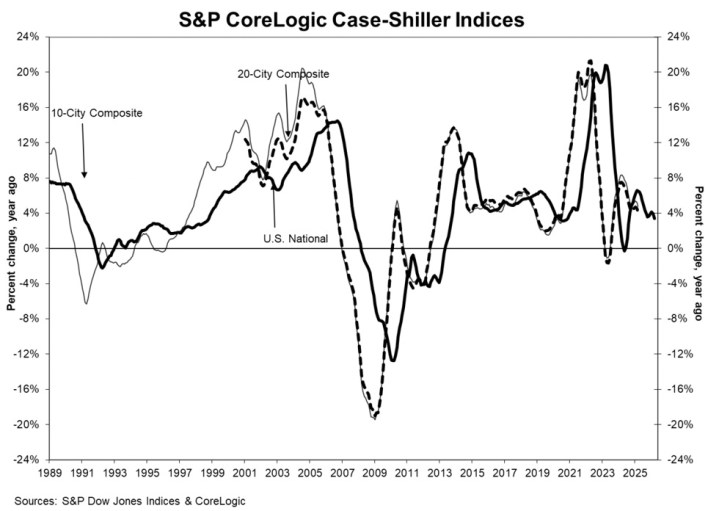
S&P CoreLogic Case-Shiller Sees 3.4% Annual Gain in March
The latest S&P CoreLogic Case-Shiller U.S. National Home Price NSA Index reported a 3.4% annual increase for March, 2025. Their 10-City Composite increased 4.8% and their 20-City Composite increased 4.1%, year-over-year. “Home price growth continued to decelerate on an annual basis in March, even as the market experienced its strongest monthly gains so far in 2025…This divergence between slowing year-over-year appreciation and renewed spring momentum highlighted how the housing market shifted from mere resilience to a broader seasonal recovery. Limited supply and steady demand drove prices higher across most metropolitan areas, despite affordability challenges remaining firmly in place.” Said Nicholas Godec, CFA, CAIA, CIPM, Head of Fixed Income Tradables & Commodities at S&P Dow Jones Indices. Click here to read the full report at S&P Dow Jones Indices. The post S&P CoreLogic Case-Shiller Sees 3.4% Annual Gain in March appeared first on Real Estate Investing Today.
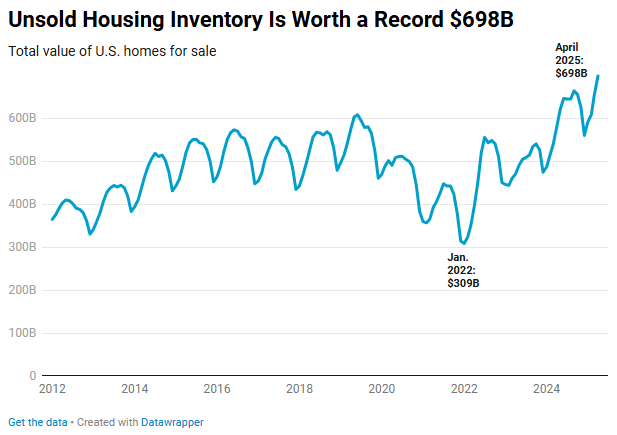
U.S. Home Sellers Are Sitting on Nearly $700 Billion Worth of Listings, an All-Time High
More than $330 billion worth of listings have been sitting on the market for 60 days or longer. Rising inventory and slow homebuying demand is pushing up the total dollar amount of home listings, and will push down home-sale prices by the end of the year. There’s a total of $698 billion worth of homes for sale in the U.S., up 20.3% from a year ago and the highest dollar amount ever. This is based on an analysis of listings on Redfin.com going back through 2012. For the total dollar value of all inventory on the market, we sum up the list price of all active U.S. listings as of the last day of each month; April 2025 is the most recent month for which data is available. For the purposes of this report, the term “value” is interchangeable with “list price”; i.e., when we refer to “total home value,” …
Can I Do a Cash-Out Refinancing on a Paid-Off House?
Yes, you can cash-out refinance a paid-off house. Here’s how. If your home is fully paid off, you’re in a strong position to qualify for a new mortgage. A cash-out refinance on a paid-off house means applying for a new loan secured by the equity you’ve built over time. This is called cash-out refinancing on a mortgage-free property, and it’s a strategy many homeowners use to unlock large sums of cash without selling their property. Because there’s no balance to pay off, the full amount of your new loan (minus closing costs) goes directly to you as cash. Key Takeaways: You can get a cash-out refinance on a home that’s completely paid off. The loan is treated as a new first-lien mortgage backed by your home’s equity. The funds can be used for anything: home upgrades, tuition, retirement, etc. You’ll start making monthly mortgage payments again. Why homeowners cash-out refinance …
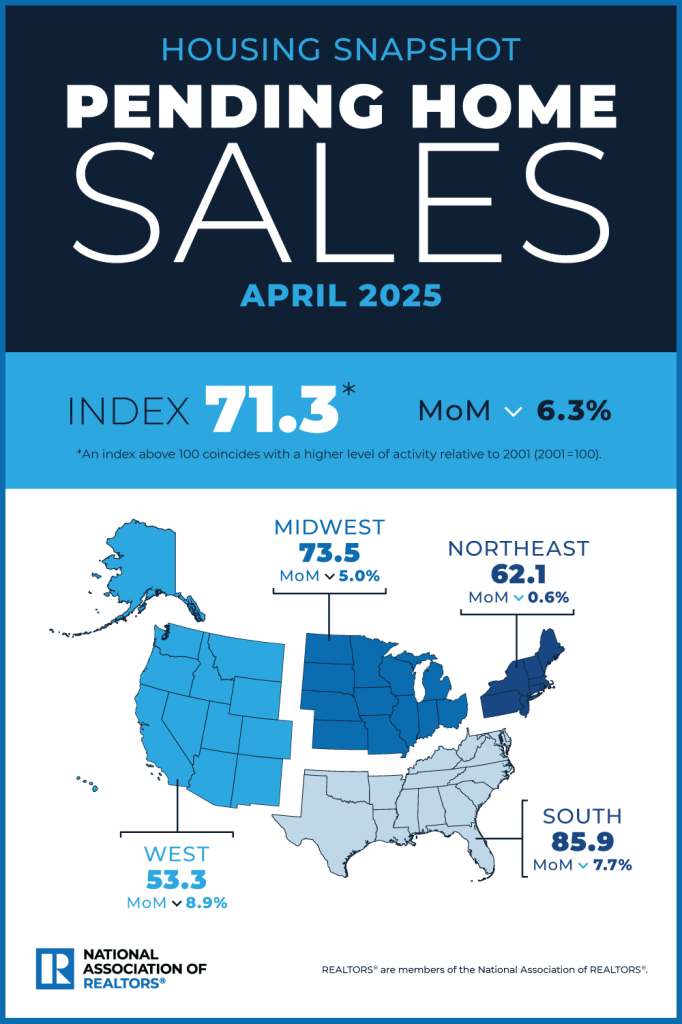
Pending Home Sales Drop 6.4% in April
The National Association of Realtors is reporting that pending home sales dropped 6.4% in in April, 2025. The NAR’s Pending Home Sales Index (a forward-looking indicator based on contract signings) came in at 71.3 in April. The NAR says mortgage rates are negating the increase in market supply. “At this critical stage of the housing market, it is all about mortgage rates…Despite an increase in housing inventory, we are not seeing higher home sales. Lower mortgage rates are essential to bring home buyers back into the housing market.” Said the NAR’s Chief Economist Lawrence Yun. Click here to read the full report at the NAR. The post Pending Home Sales Drop 6.4% in April appeared first on Real Estate Investing Today.
Who Actually Owns the Various Power Tool Brands?
Today’s graphic from Pro Tool Reviews lays bare the answer about which companies own which tool brands. They say that if you’ve ever wondered who owns Craftsman Tools, Milwaukee Tool, Mac Tools, Skil, or any other major tool manufacturing brand, this interesting chart might answer most of your questions. Indeed… Stay safe and have a Happy Friday!! (as of May 2024) Hat tip to Pro Tool Reviews. The post Who Actually Owns the Various Power Tool Brands? appeared first on Real Estate Investing Today.
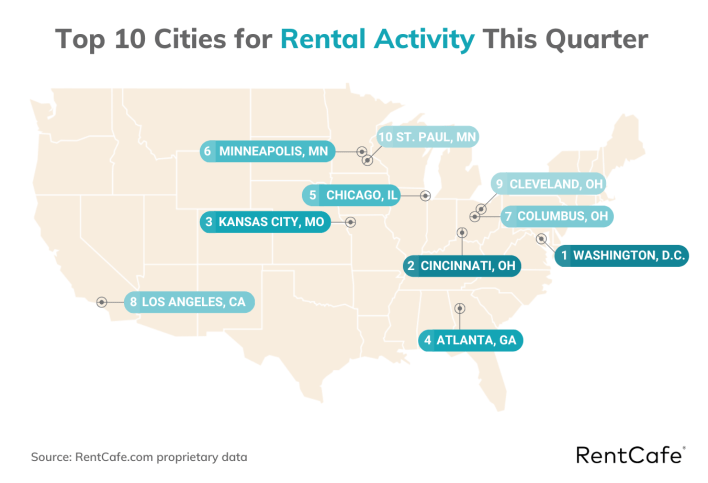
RentCafe’s Top 10 Rental Cities for Q1 2025
RentCafe says that with spring in full bloom and summer getting closer, it’ll soon be time for the busiest moving season, when renters are searching for apartments. With that in mind, their new quarterly Rental Engagement Tracker for Q1 2025 has identified the top 10 rental cities for the quarter. Rentcafe says their new REnT (Rent Engagement Tracker) series format will offer an even clearer, long-term view of renter trends and shifting preferences across the top 150 U.S. cities. “Washington, D.C., attracted the most interest from renters in the first quarter of 2025 by showcasing strong online activity across all metrics. Next, Cincinnati comes in second after soaring nine spots since one year ago, followed by Kansas City, MO, in third place after a 12-spot ascent. Then, Atlanta drops one position into #4, and Chicago climbs one spot to #5.” Click here to read the full report at RentCafe. …
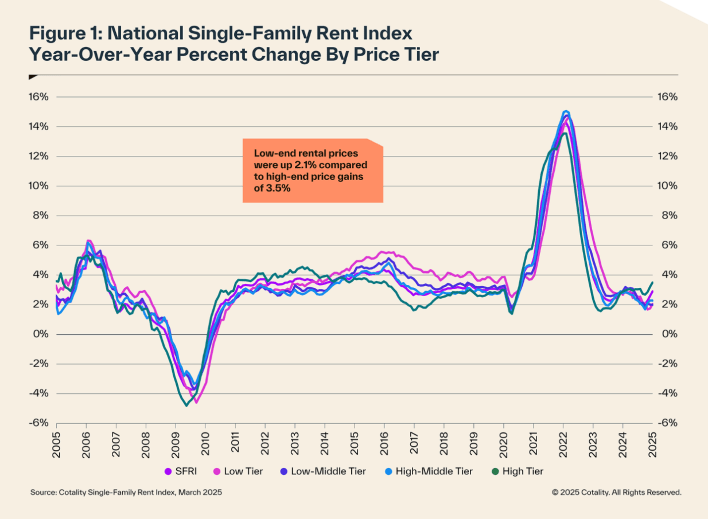
Cotality SFRI: Rent Up 2.9% Year-Over Year in March
According to the latest Cotality (formerly CoreLogic) Single-Family Rent Index (SFRI), U.S. single-family home rental prices increased 2.9% year over year in March, 2025. “Single-family rent growth picked up for the third consecutive month in March, appearing to have bottomed out in December of last year…National trends are firming. Markets with large numbers of new rental units coming online showed softness in single-family rents, as these new units give renters some bargaining power. This can be seen in the single-family rent growth in Dallas, which showed an annual decrease of 0.5% in March” Said Cotality senior principal economist Molly Boesel. Click here to read the full report at Cotality (formerly Corelogic) The post Cotality SFRI: Rent Up 2.9% Year-Over Year in March appeared first on Real Estate Investing Today.
Charles Tassell Accepts Position with USDA in Trump Administration
The headline says it all; National REIA’s Charles Tassell is heading to the U.S. Department of Agriculture. The USDA announced this week their latest slate of presidential appointments for key positions at the U.S. Department of Agriculture (USDA) including the Food and Nutrition Service (FNS), Farm Service Agency (FSA) and Rural Development (RD). Charles will serve as the State Director for Rural Development in his home state of Ohio. Click here to wish him well. Brooke Rollins “President Trump is putting Farmers First, and so is the incredible team we are building at the Department of Agriculture. Our latest additions to the USDA family are personally invested in ensuring farmers and rural America prosper. I look forward to seeing the work they will do supporting farmers, ranchers, and producers across the country by implementing President Trump’s America First policies.” Said USDA Secretary Brooke Rollins. Rebecca McLean “It has been …
Washington State Institutes Rent Control
In early May, Washington Governor Bob Ferguson (D) signed a bill into law that will limit annual rent increases (rent control). According to Yahoo News, the measure (HB 1217) caps rent increases at 7% plus inflation or 10% (whichever is lower) and includes single-family homes. The rent for manufactured home rent is also capped at 5%. Yahoo News says this makes the state among the first in the country to “provide protections for tenants.” Rent control continues to be on the march…. “Washington needs more affordable housing — a lot more,” Governor Ferguson said. “We must make it easier, faster and less expensive to build housing of all kinds. These bills will address this pressing need.” WA Governor Bob Ferguson Click here to read the full story at Yahoo News. Click here to read the media release from Governor Bob Furguson. The post Washington State Institutes Rent Control appeared …


