
- 1 in 7 home-purchase agreements fell through last month. The share was higher in many parts of Florida, which is home to 5 of the 10 metros with the highest cancellation rates.
- Redfin agents say that when a deal is on shaky ground, it can be an opportunity for outbid buyers to get in the backup-offer position.
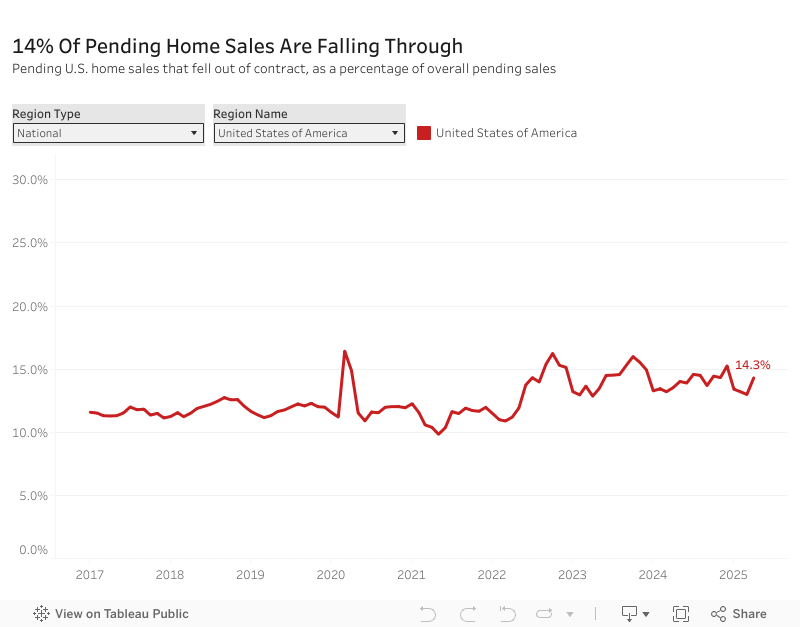
Roughly 56,000 U.S. home-purchase agreements were canceled in April, equal to 14.3% of homes that went under contract that month. That’s up from 13.5% a year earlier and is the highest April share in records dating back to 2017, with the exception of April 2020, when the coronavirus brought the housing market to a halt.
This is based on a Redfin analysis of MLS pending-sales data. The data is seasonal; typically, there’s a higher share of cancellations near the end of the year and a lower share in the spring. That’s why we’re comparing this time of year (April 2025, the most recent month for which this data is available) to past Aprils. Please note: Homes that fell out of contract during a given month didn’t necessarily go under contract that same month. This data is subject to revision.
Homebuyers are skittish for several reasons:
- Economic uncertainty: Redfin agents report that some buyers are getting cold feet due to widespread economic and political uncertainty. Tariffs, layoffs, and federal policy changes are among the factors prompting people to stay put instead of move. A recent Redfin survey found that nearly one of every four Americans is scrapping plans to make a major purchase due to tariffs.
- It’s a buyer’s market. Housing inventory is at a five-year high, and demand is slowing, meaning the buyers who are in the market often have room to negotiate. Some house hunters are backing out during the inspection period because a better house has or might come along.
- Sticker shock: Mortgage rates and home prices remain stubbornly high, with April’s average rate hitting 6.73%—more than double the pandemic record low. Combined with economic uncertainty, high housing costs are causing some would-be buyers to change their minds at the eleventh hour.
Outbid Buyers Can Ask Their Agent to Find Out If the Seller Is Accepting Backup Offers
In cases where the deal does fall through, one buyer’s loss can be another’s gain, pointed out Alison Williams, a Redfin Premier real estate agent in Sacramento, CA.
“Two of my buyers have won deals this way—where the previous buyer canceled and then we wrote an offer before the home was even back on the market, and the seller accepted,” Williams said. “It’s a tactic that has been working really well, especially when it’s a home my client was already interested in. I will circle back with the listing agent to see if the other buyer is wavering.”
If you’re a buyer who was just outbid on a home, have your agent ask the listing agent to keep your offer in mind as a backup in case the existing deal falls through.
Another piece of advice for buyers: You may have negotiating power if you’re bidding on a home that’s back on the market after falling out of contract. When a deal falls through, it can give the impression that there’s something wrong with the home, even if that’s not the case. This may give the next bidder room to ask for concessions and/or negotiate on price.
Florida Is Home to 5 of the 10 Metros With the Highest Cancellation Rates
Atlanta leads the nation in canceled deals, with one in five (20%) pending home sales falling through in April. It’s followed by Orlando, FL (19.4%), Tampa, FL (19.1%), Riverside, CA (19.1%) and Miami (18.9%). Rounding out the top 10 are Fort Lauderdale, FL (18.9%), Fort Worth, TX (18.7%), Las Vegas (18.6%), Jacksonville, FL (18.4%) and San Antonio (18.2%).
Redfin analyzed the 50 most populous U.S. metropolitan areas and included in this analysis the 44 with sufficient data.
Of the 10 metros with the highest cancellation rates, five are in Florida and two are in Texas. The two states have been building more homes than anywhere else in the country, prompting some buyers to back out of deals because they’re confident they will be able to find a different home that works better for them. Florida has more homes for sale than ever before. Some buyers in the Sunshine State are also getting cold feet due to increasing natural disasters and soaring insurance and HOA fees.
The lowest cancellation rate was in Nassau County, NY, where 4.8% of pending home sales fell through in April. Next came Boston (8.1%), Montgomery County, PA (8.1%), Minneapolis (8.4%), New York (8.7%), Milwaukee (9.2%), Seattle (9.8%), Newark, NJ (9.8%), Warren, MI (10.4%) and New Brunswick, NJ (10.5%).
Anaheim and Seattle Saw the Biggest Increases in Cancellations
In Anaheim, CA, 15.7% of pending sales fell out of contract in April, up 3.1 percentage points from 12.6% a year earlier—the biggest increase among the major U.S. metros Redfin analyzed. Next came Seattle (2.8 ppts), Milwaukee (2.7 ppts), Los Angeles (2.6 ppts) and Nashville (2.6 ppts).
Just 10 metros Redfin analyzed saw cancellations decline, led by Detroit (-3 ppts), Jacksonville (-1.3 ppts), Portland, OR (-1 ppt), Cleveland (-0.6 ppts) and West Palm Beach (-0.4 ppts).
Metro-Level Summary
| U.S. metro area | April 2025: Pending sales that fell out of contract, as % of overall pending sales | April 2024: Pending sales that fell out of contract, as % of overall pending sales |
|---|---|---|
| Anaheim, CA | 15.7% | 12.6% |
| Atlanta, GA | 20.0% | 17.6% |
| Austin, TX | 13.2% | 13.1% |
| Baltimore, MD | 11.9% | 10.7% |
| Boston, MA | 8.1% | 8.0% |
| Chicago, IL | 13.6% | 13.7% |
| Cincinnati, OH | 11.4% | 10.7% |
| Cleveland, OH | 15.3% | 15.9% |
| Columbus, OH | 14.2% | 13.7% |
| Dallas, TX | 16.3% | 16.4% |
| Denver, CO | 16.4% | 14.9% |
| Detroit, MI | 13.2% | 16.1% |
| Fort Lauderdale, FL | 18.9% | 18.6% |
| Fort Worth, TX | 18.7% | 16.8% |
| Houston, TX | 17.0% | 15.3% |
| Indianapolis, IN | 14.1% | 14.2% |
| Jacksonville, FL | 18.4% | 19.7% |
| Las Vegas, NV | 18.6% | 18.2% |
| Los Angeles, CA | 16.9% | 14.3% |
| Miami, FL | 18.9% | 16.5% |
| Milwaukee, WI | 9.2% | 6.5% |
| Minneapolis, MN | 8.4% | 8.4% |
| Montgomery County, PA | 8.1% | 6.0% |
| Nashville, TN | 14.5% | 11.9% |
| Nassau County, NY | 4.8% | 3.9% |
| New Brunswick, NJ | 10.5% | 8.6% |
| New York, NY | 8.7% | 7.6% |
| Newark, NJ | 9.8% | 8.8% |
| Orlando, FL | 19.4% | 19.6% |
| Philadelphia, PA | 11.8% | 10.8% |
| Phoenix, AZ | 18.0% | 17.2% |
| Pittsburgh, PA | 14.2% | 13.0% |
| Portland, OR | 14.5% | 15.6% |
| Providence, RI | 10.7% | 9.9% |
| Riverside, CA | 19.1% | 16.9% |
| Sacramento, CA | 16.3% | 14.6% |
| San Antonio, TX | 18.2% | 17.8% |
| San Diego, CA | 17.3% | 15.1% |
| Seattle, WA | 9.8% | 6.9% |
| Tampa, FL | 19.1% | 19.3% |
| Virginia Beach, VA | 13.7% | 11.4% |
| Warren, MI | 10.4% | 9.6% |
| Washington, D.C. | 10.6% | 9.7% |
| West Palm Beach, FL | 15.3% | 15.7% |
| National—U.S.A. | 14.3% | 13.5% |
Written by: Lily Katz