
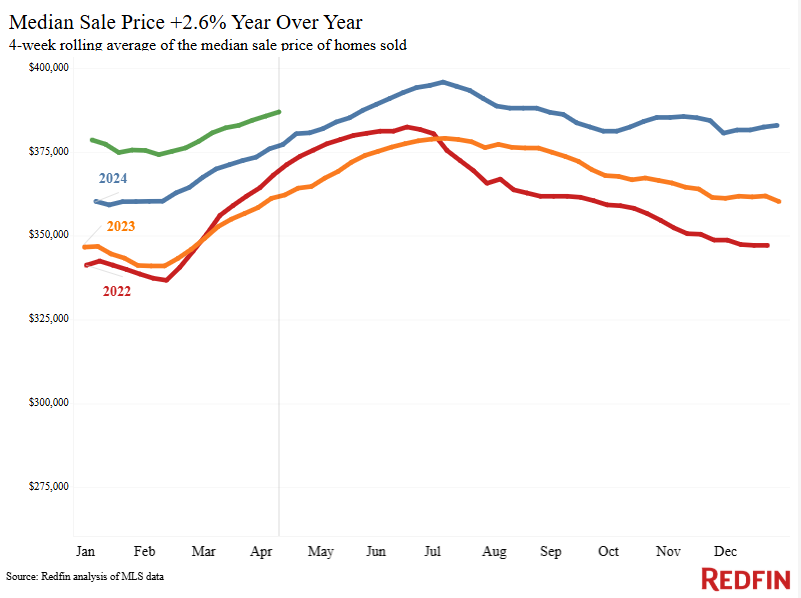
U.S. home prices are growing half as fast as they were at the end of last year.
Nationwide, the median home-sale price rose 2.6% year over year during the four weeks ending April 13. That’s roughly the same as the increases we’ve seen over the past month, but down from 5% to 6% growth at the end of 2024 and the start of 2025.
On a metro level, the median home-sale price is down from a year ago in 10 of the 50 most populous U.S. metro areas, mostly in Texas and Florida.
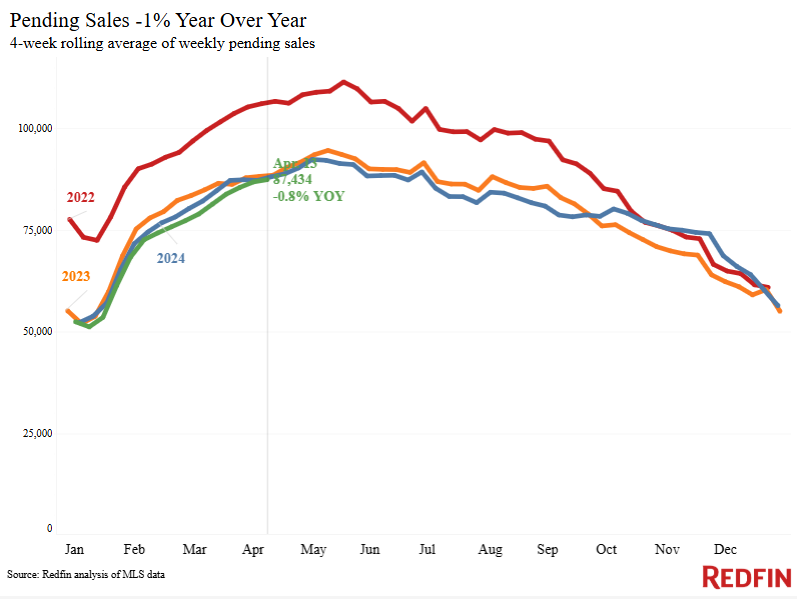
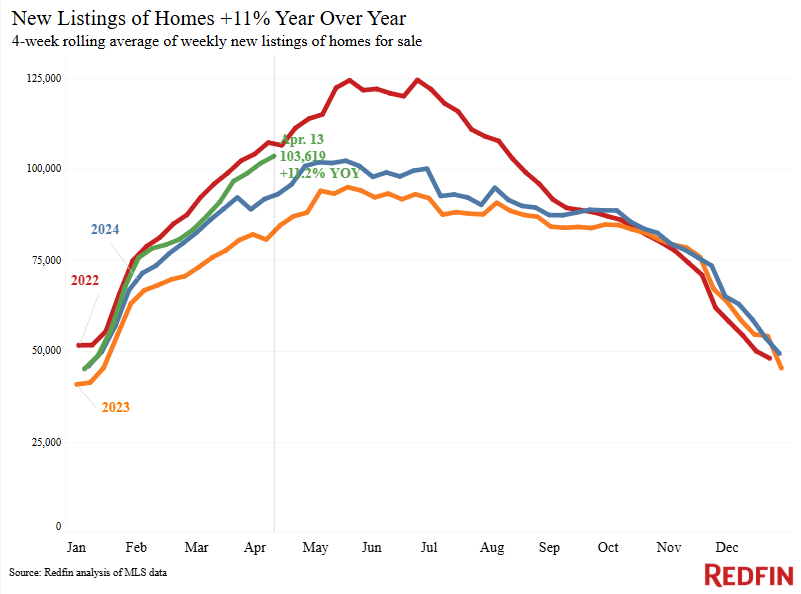
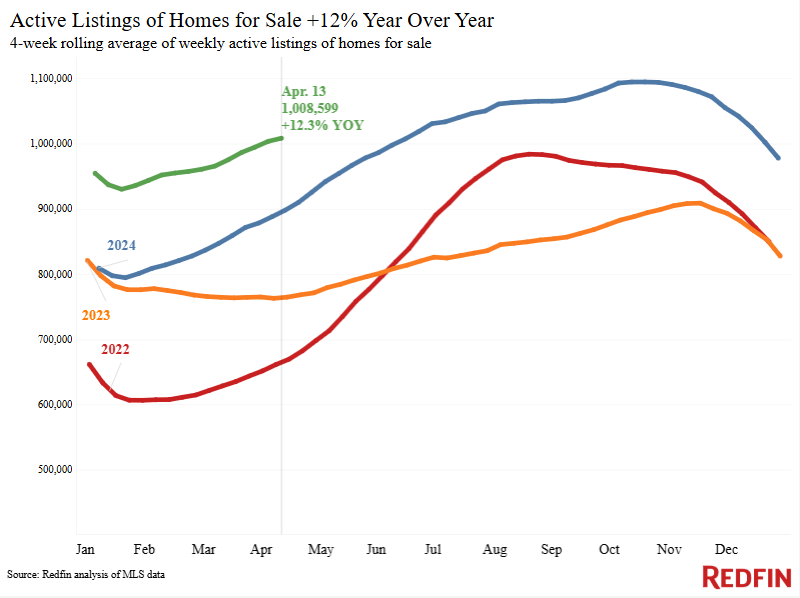
Price growth is losing steam nationally–and prices are dropping in some metro areas–because supply is rising while demand is slow. New listings of homes for sale are up 11.2% year over year, and the total number of homes for sale is up 12.3%. Meanwhile, pending home sales declined roughly 1% from a year ago, mortgage-purchase applications are down 5% week over week, and Redfin agents in many parts of the country report that house hunters are backing off.
Homebuying demand is slow for two key reasons:
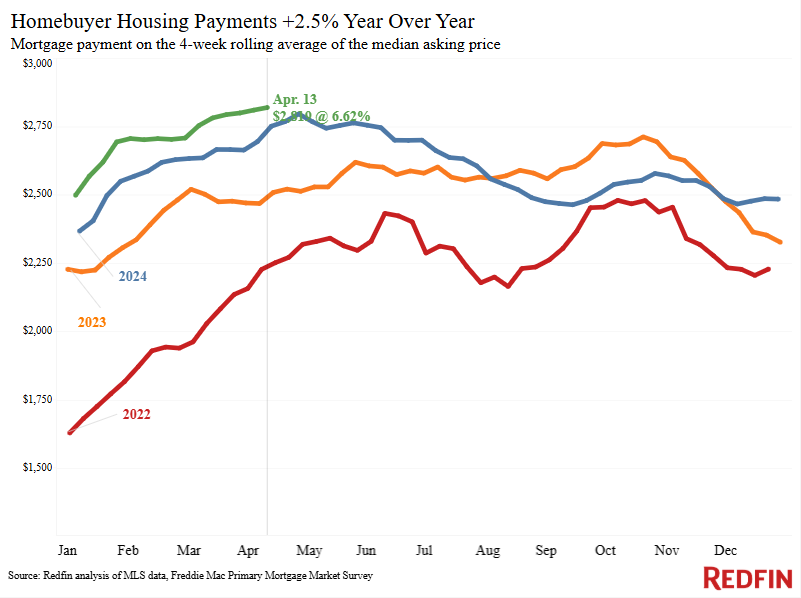
- Record-high housing costs. The median U.S. monthly housing payment hit an all-time high of $2,819 this week due to stubbornly high mortgage rates and rising home prices, though buyers may get a bit of relief on prices in the coming months if growth continues to lose steam.
- Widespread economic instability. Tariffs, stock-market volatility and recession jitters are weighing heavily on consumer confidence, sending many would-be buyers to the sidelines. This sense of financial instability, along with concerns that home values could decline, is making many people think twice before making a big purchase.
New listings are rising in part because some homeowners want to sell their house now before a potential economic downturn further dampens demand and possibly drives down home values. There’s also a holiday effect at play; part of the reason for the year-over-year increase in new listings is because Easter fell into the comparable period in 2024 but hasn’t occurred yet in 2025.
“A lot of buyers, especially first-timers, are backing off because they’re nervous about a potential recession,” said Venus Martinez, a Redfin Premier agent in Los Angeles. “Some house hunters are hanging out on the sidelines because they’re hopeful mortgage rates will come down soon. The buyers who are still active, typically those who need to move, are picky and unwilling to pay over asking price. And those buyers have the right strategy: Many of today’s sellers are willing to negotiate the price down.”
For Redfin economists’ takes on the housing market, please visit Redfin’s “From Our Economists” page.
Leading indicators
| Indicators of homebuying demand and activity | ||||
| Value (if applicable) | Recent change | Year-over-year change | Source | |
| Daily average 30-year fixed mortgage rate | 6.86% (April 16) | Near highest level in 2 months | Down from 7.3% | Mortgage News Daily |
| Weekly average 30-year fixed mortgage rate | 6.62% (week ending April 10) | Lowest level since mid-December | Down from 6.88% | Freddie Mac |
| Mortgage-purchase applications (seasonally adjusted) | Down 5% from a week earlier (as of week ending April 11) | Up 13% | Mortgage Bankers Association | |
| Touring activity | Up 39% from the start of the year (as of April 14) | At this time last year, it was up 33% from the start of 2024 | ShowingTime, a home touring technology company | |
| Google searches for “home for sale” | Up 10% from a month earlier (as of April 14) | Up 4% | Google Trends | |
| We excluded the Redfin Homebuyer Demand Index this week to ensure data accuracy. | ||||
Key housing-market data
| U.S. highlights: Four weeks ending April 13, 2025
Redfin’s national metrics include data from 400+ U.S. metro areas, and are based on homes listed and/or sold during the period. Weekly housing-market data goes back through 2015. Subject to revision. |
|||
| Four weeks ending April 13, 2025 | Year-over-year change | Notes | |
| Median sale price | $387,000 | 2.6% | |
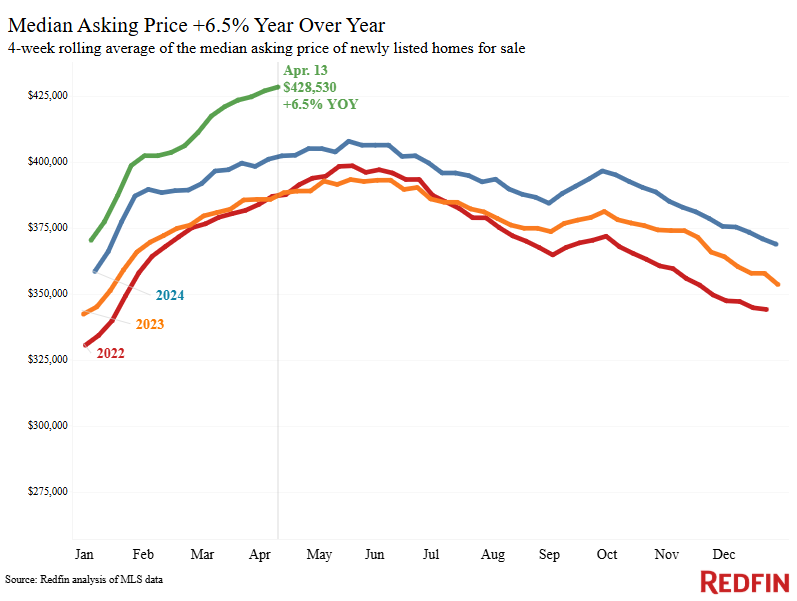
| Median asking price | $428,530 | 6.5% | |
| Median monthly mortgage payment | $2,819 at a 6.62% mortgage rate | 2.5% | Record high |
| Pending sales | 87,434 | -0.8% | |
| New listings | 103,619 | 11.2% | |
| Active listings | 1,008,599 | 12.3% | Smallest increase in a year |
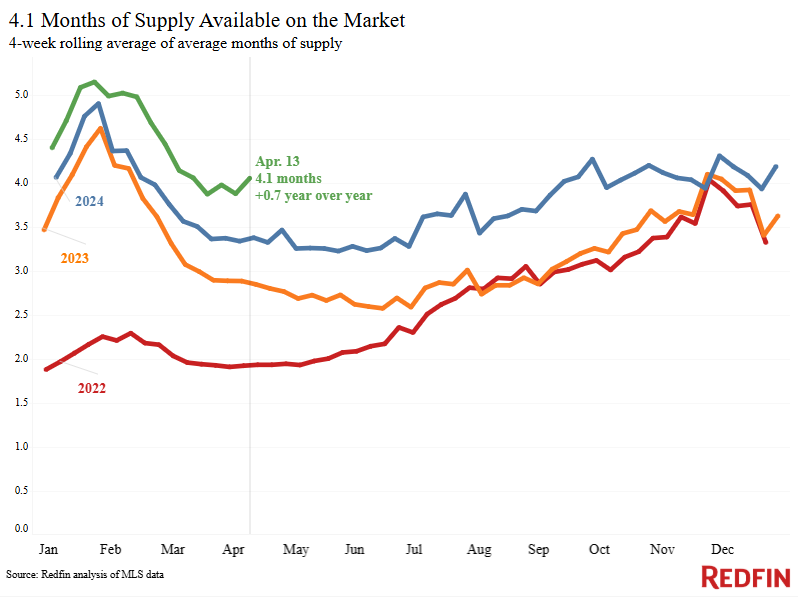
| Months of supply | 4.1 | +0.7 pts. | 4 to 5 months of supply is considered balanced, with a lower number indicating seller’s market conditions |
| Share of homes off market in two weeks | 39.4% | Down from 42% | |
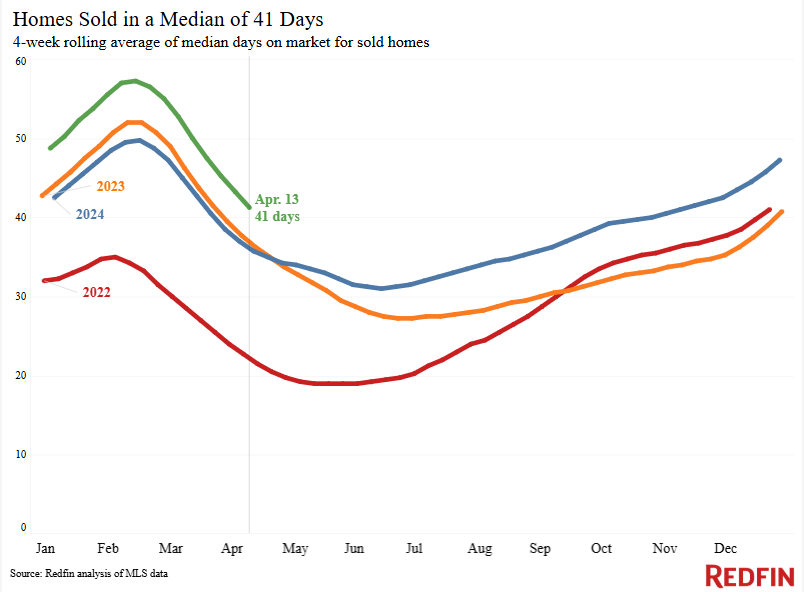
| Median days on market | 41 | +5 days | |
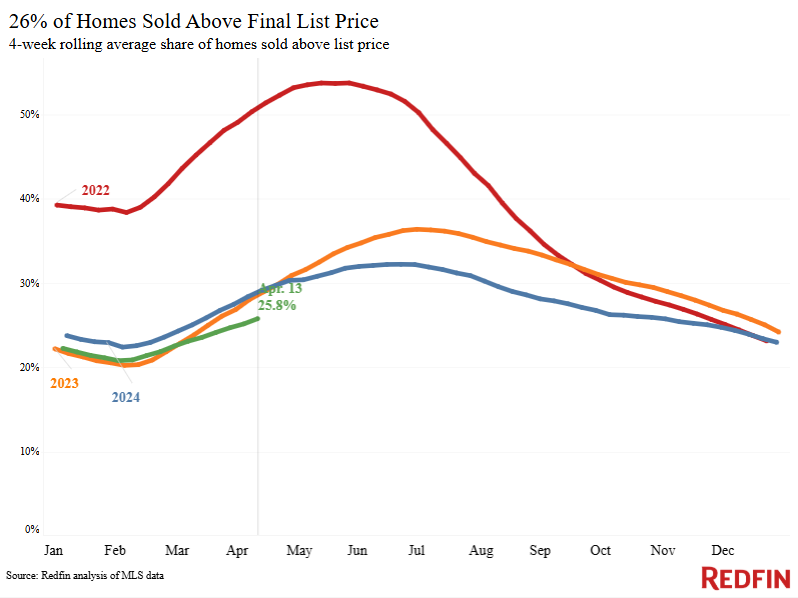
| Share of homes sold above list price | 25.8% | Down from 29% | |
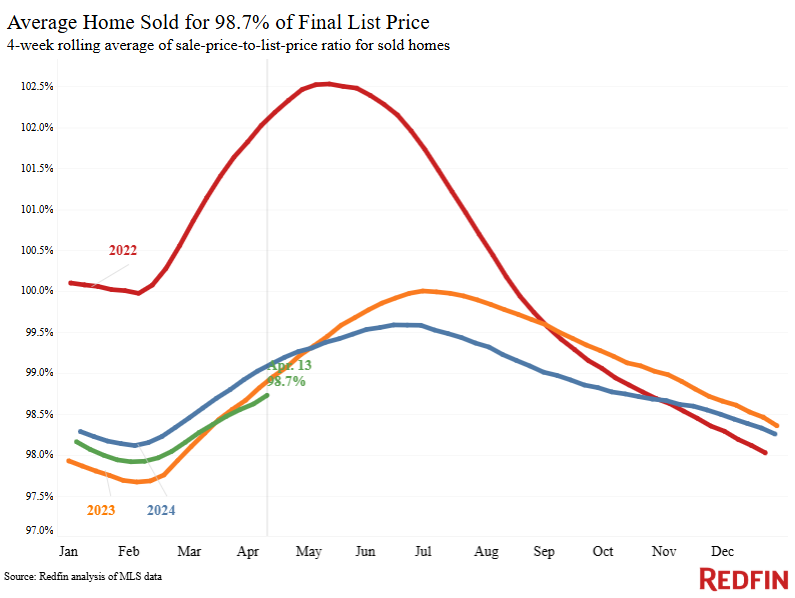
| Average sale-to-list price ratio | 98.7% | Down from 99.1% | |
|
Metro-level highlights: Four weeks ending April 13, 2025 Redfin’s metro-level data includes the 50 most populous U.S. metros. Select metros may be excluded from time to time to ensure data accuracy. |
|||
|---|---|---|---|
| Metros with biggest year-over-year increases | Metros with biggest year-over-year decreases |
Notes |
|
| Median sale price | Newark, NJ (10.9%)
Cleveland (10.6%) New Brunswick, NJ (9.2%) Milwaukee (9%) Philadelphia (8.3%) |
Jacksonville, FL (-2.8%)
San Antonio (-1.8%) Montgomery County, PA (-1.7%) Oakland, CA (-1.5%) Austin, TX (-1.2%) Portland, OR (-1.1%) Dallas (-0.8%) Sacramento, CA (-0.6%) Orlando, FL (-0.4%) Fort Worth, TX (-0.2%) |
Declined in 10 metros |
| Pending sales | Columbus, OH (16.8%)
Cincinnati (11.3%) Boston (11.1%) Indianapolis (9.5%) Montgomery County, PA (8.1%) |
Cleveland (-24.8%)
Miami (-21.7%) Fort Lauderdale, FL (-18.6%) Houston (-12.5%) Las Vegas (-12.4%) |
Declined in roughly half the metros |
| New listings | Washington, D.C. (28.8%)
Boston (27.6%) Montgomery County, PA (26.8%) San Diego (26.6%) Pittsburgh (23.7%) |
Houston (-6.2%)
Cleveland (-5.1%) San Antonio (-2.3%) San Jose, CA (-1.6%) Nassau County, NY (-1.3%) |
Declined in 5 metros |
Refer to our metrics definition page for explanations of all the metrics used in this report.

Written by: Dana Anderson